Figure 1.
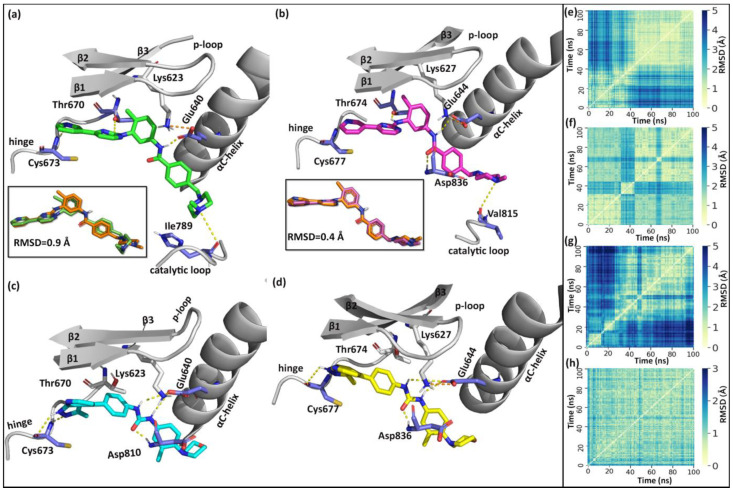
H-bond interactions of imatinib and compound 14 with c-KIT and PDGFRα from the molecular dynamics (MD) simulations. Proteins were represented in grey color cartoon representation. H-bond interactions are represented by yellow dotted lines and residues forming H-bonds are shown in a purple color. (a) Binding interactions between imatinib and c-KIT. The overlap between the crystal ligand pose (salmon) and the MD binding pose (green) of imatinib at the binding site (root mean square deviation (RMSD) = 0.9 Å). (b) Binding interactions between imatinib and PDGFRα. The overlap between the crystal ligand pose (salmon) and the MD binding pose (magenta) of imatinib at the binding site (RMSD = 0.4 Å). (c) Binding interactions between compound 14 (cyan)_ and c-KIT. (d) Binding interactions between compound 14 and PDGFRα. The pairwise RMSD plots of the ligands from the MD simulation of (e) imatinib and c-KIT (f) imatinib and PDGFRα (g) compound 14 and c-KIT (h) compound 14 and PDGFRα. The protein–ligand complexes were first aligned by least square fitting the protein backbone atoms. The ligand RMSD was calculated based on the ligand heavy atoms. The pairwise RMSD plot shows the ligand RMSD of each frame in the trajectory.

