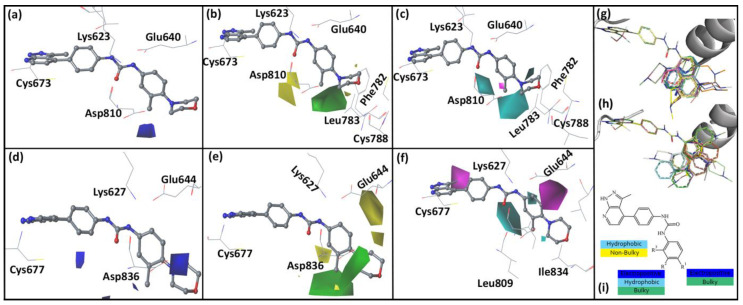
Figure 2.
Contour maps generated based on the CoMFA and CoMSIA models for c-KIT and PDGFRα with compound 14 used as a reference. Blue and red contours indicate electropositive and electronegative substituents’ favorable regions, respectively. Green and yellow contours indicate steric bulk substituents’ favorable and unfavorable regions, respectively. Cyan and purple colors contours represent hydrophobic favorable and unfavorable regions. (a) Electrostatic contour map for the c-KIT CoMFA model. (b) Steric contour map for the c-KIT CoMFA model (c) Hydrophobic contour map for the c-KIT CoMSIA model. (d) Electrostatic contour map for the PDGFRα CoMFA model. (e) Steric contour map for the PDGFRα CoMFA model. (f) Hydrophobic contour map for the PDGFRα CoMSIA model. Alignments used for the development of the 3D-QSAR models. (g) Alignment of the compounds inside c-KIT. (h) Alignment of the compounds inside PDGFRα. (i) Scheme developed based on the 3D-QSAR models for designing new compounds.

