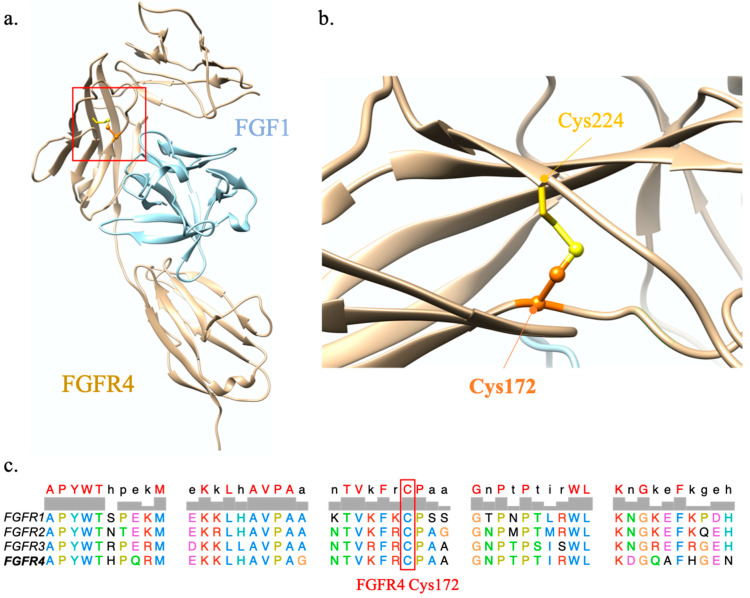
Figure 4.
FGFR4 modelling analysis. (a) FGFR4 and FGF1 model complex. The red square indicates the region impacted by the FGFR4 p.Cys172Gly mutation; (b) zoom on Cys172 and its disulfide bond involving Cys224; (c) sequence alignment of the four transmembrane members of the fibroblast growth factor family (FGFR) family. Cys172 is in orange ball-and-sticks and the Cys224 in golden sticks. FGFR4 is in tan ribbon and FGF1 in light blue ribbon (PDB ID 1qct) [21].

