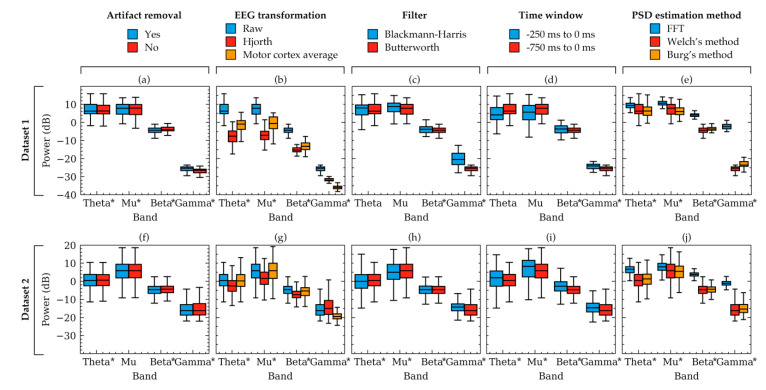
Figure 4.
Box plots showing example power variation within two subjects. The variations occurred due to the selection of choices available in artifact removal (a,f), EEG transformation (b,g), filter (c,h), time-window (d,i), and PSD estimation method (e,j). Powers were computed from the EEG signals of two random subjects from Dataset 1 (a–e) and Dataset 2 (f–j), respectively. Each subfigure represents the effect of choices available in a factor for the subject. The other factors were kept constant as follows: artifact removal = yes, EEG transformation = raw, filter = Butterworth, time window = 750 ms, method = Welch’s method. The boxes indicate the quartiles of the samples while the whiskers extend to show the rest of the distribution up to 1.5 inter-quartile range. Significant models from Table 1 are indicated in the figure using asterisks (*) near the frequency band names.

