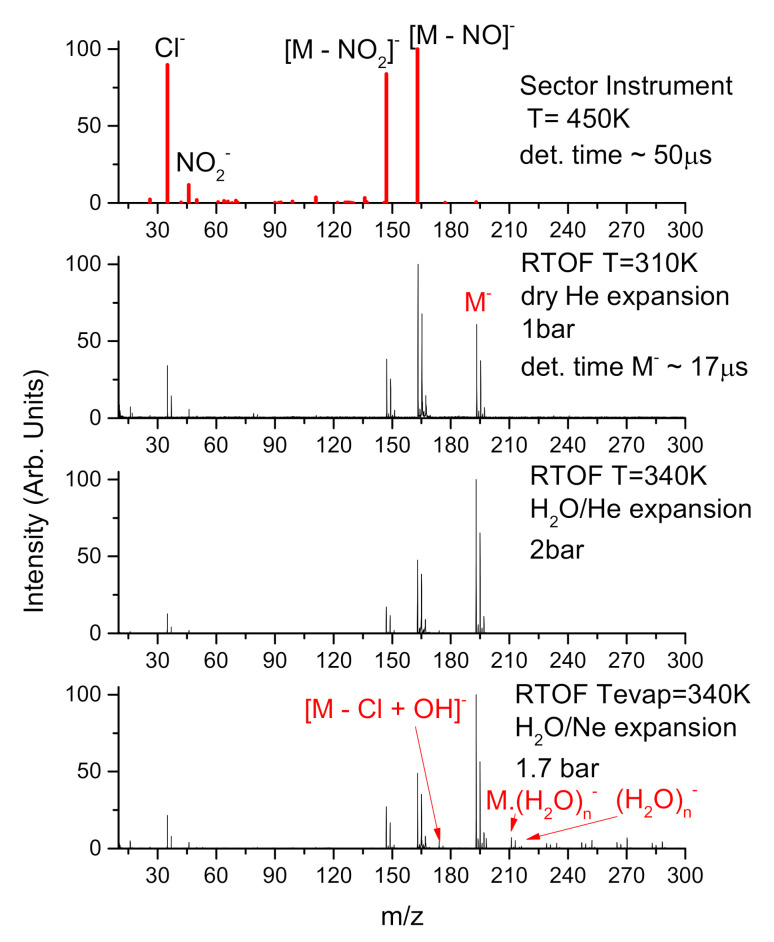
Figure 2.
Mass spectra of negative ions formed by CHClNO interaction with electrons in the range of 0–14 eV. Top bar graph spectrum is for isolated molecule, obtained as an integral of the individual ion yields measured at the electron attachment spectrometer with sector mass analyzer in Ufa. Below are the spectra from RTOF measurements with molecular beam of CHClNO in He, hydrated He and hydrated Ne as a buffer gas—increasing hydration from top to bottom.

