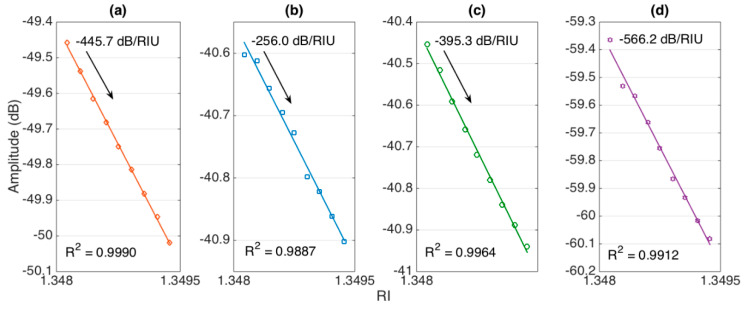
Figure 7.
Evaluation of amplitude-level sensitivity for each ball resonator. The charts show the spectral amplitude of the spectral features for different RI values (1.34798–1.34922). The sensitivity was evaluated as the slope of linear regression, R2 = coefficient of determination. Ball resonator diameters: (a) 547 μm; (b) 532 μm; (c) 494 μm; (d) 466 μm.

