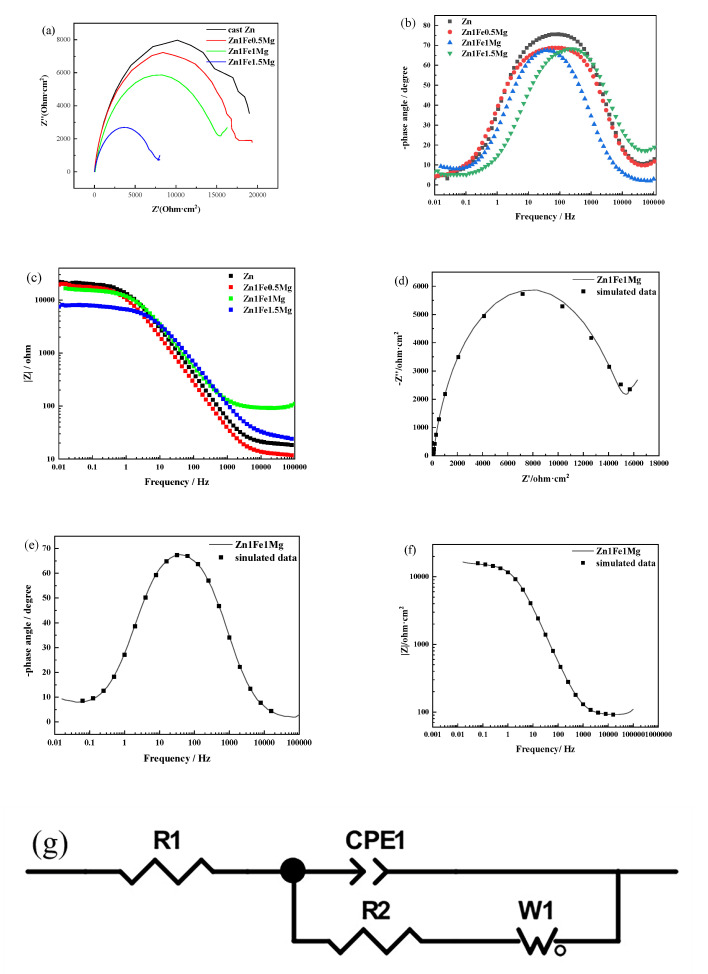
Figure 6.
Electrochemical impedance spectroscopy (EIS) spectra of Zn-Fe-Mg in SBF solution at room temperature: (a) Nyquist diagram comparison and simulated results of the Zn-Fe-Mg alloy: (b) Bode phase angle diagram; (c) Bode impedance–frequency diagram; (d–f) Nyquist diagram, phase angle diagram, and impedance-frequency diagram of Zn1Fe1Mg and simulated data; (g) The equivalent circuit of EIS spectra for the Zn-1Fe-Mg alloy: R1 is the solution resistance; CPE1 is constant phase angle element; R2 is the charge-transfer resistance; W1 is the Warburg finite-length diffusion impedance.

