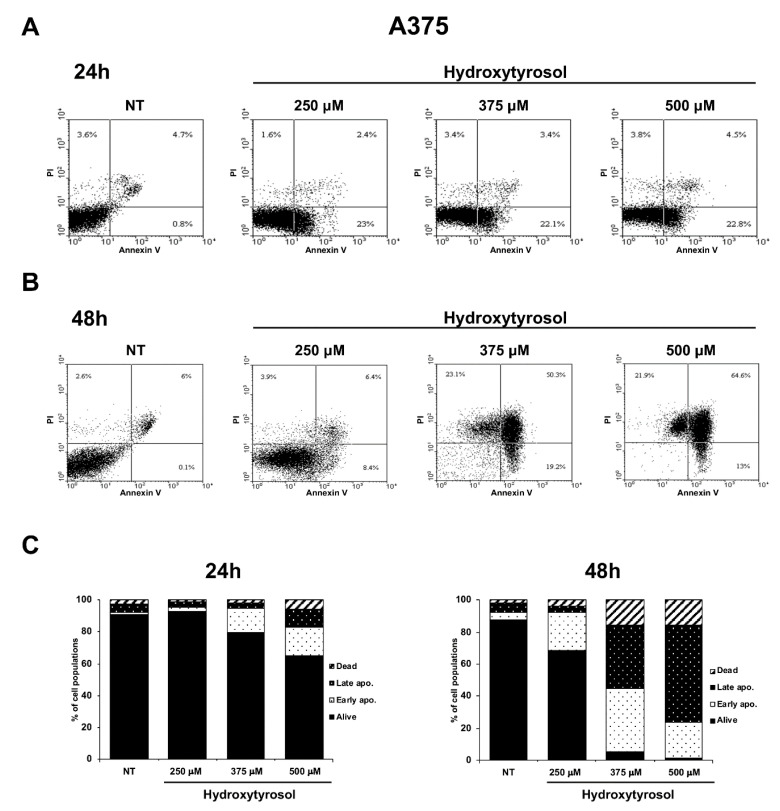
Figure 3.
Flow cytometric analysis of A375 melanoma cells treated with hydroxytyrosol. A375 cells untreated (NT) or treated for 24 h (A) and 48 h (B) with 250 μM, 375 μM, and 500 μM of hydroxytyrosol were analysed by annexin V-FITC/PI staining through flow cytometry. The percentage of cells alive (lower left quadrant), early apoptotic cells (lower right quadrant), late apoptotic cells (upper right quadrant), and necrotic cells (upper left quadrant) were reported in flow cytometric graphics. The graphics of flow cytometric analysis are representative of several independent experiments. The percentage of early apoptotic, late apoptotic, and necrotic A375 cells, untreated (NT) or treated for 24 h (left graphic) and for 48 h (right graphic) with hydroxytyrosol, as mean values of several different experiments are reported in the histograms (C).

