Figure 5.
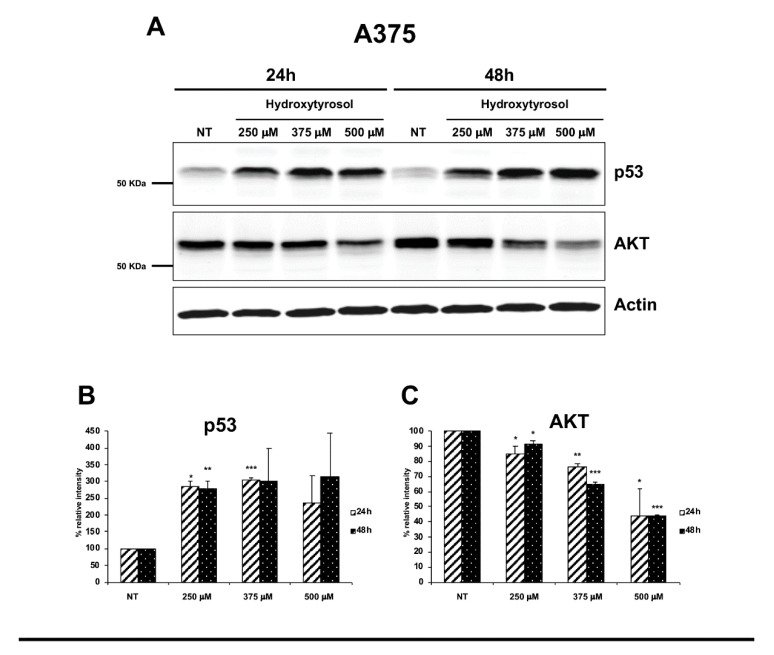
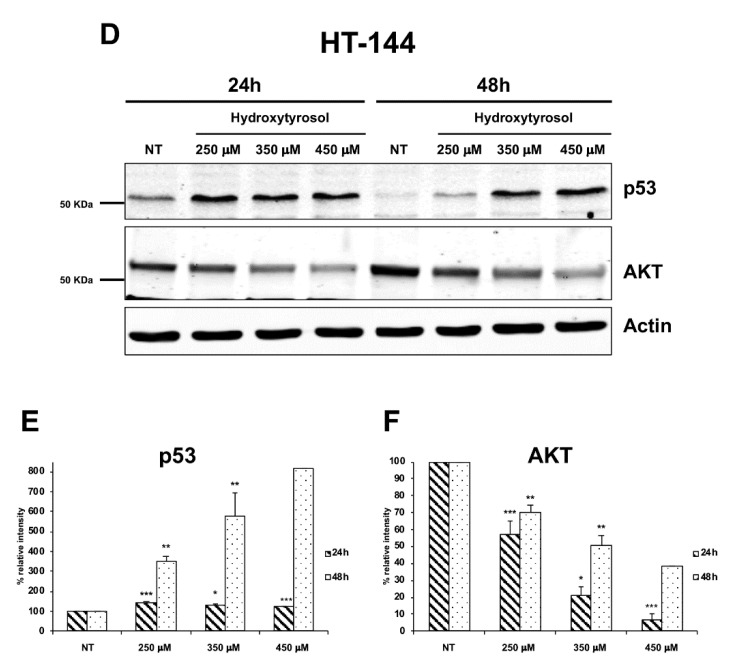
Expression of p53 and AKT proteins in hydroxytyrosol treated melanoma cells. A375 cells (A–C) were treated with 250 μM, 357 μM, and 500 μM of hydroxytyrosol and HT-144 cells (D–F) were treated with 250 μM, 350 μM, and 450 μM of hydroxytyrosol for 24 h and 48 h. The expression of p53, (A,D, upper panels, B,E) and AKT signalling proteins, (A,D, middle panels, C,F), was analysed in A375 and HT-144 cell lines in response to the treatment with hydroxytyrosol through western blot experiments. The equal protein loading was confirmed by the analysis of β-actin expression, (A,D, lower panels). The data are representative of several western blot experiments. The error bars indicate the standard deviation. Statistical significance was analysed by Student’s t-test: * p < 0.05 was considered significant; ** p < 0.01 highly significant; *** p < 0.001 very highly significant.


