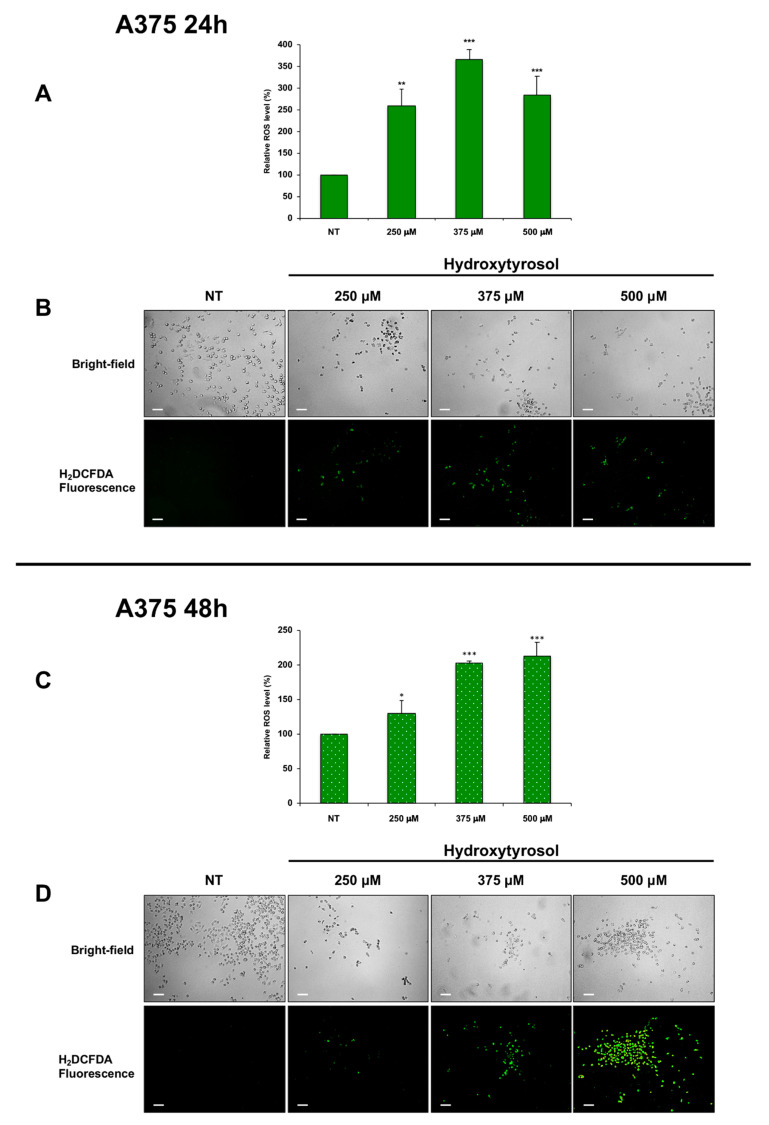
Figure 8.
Amount of ROS in A375 cells treated with hydroxytyrosol. A375 melanoma cells were treated with 250 μM, 375 μM, and 500 μM of hydroxytyrosol for 24 h (A,B) and 48 h (C,D). The green-fluorescent emission of DCF was quantified (A,C) and was analysed (B,D) through an inverted fluorescence microscope. The intensity of fluorescence that is directly proportional to hydrogen peroxide concentration was reported in the histograms (A,C) as the mean values of ROS acquired from almost three different experiments performed in triplicate and is expressed as a percent of ROS produced in unstimulated cells. The error bars indicate the standard deviation, statistical significance was analysed by Student’s t-test: * p < 0.05 was considered significant; ** p < 0.01 highly significant; *** p < 0.001 very highly significant. The bright-field and fluorescence photomicrography of treated and untreated A375 cells stained with H2DCFDA probe are reported in (B,D). Images were acquired with an inverted Leica fluorescence microscope using a ×10 objective. Scale bar: 100 μm. The images are representative of almost three different experiments.

