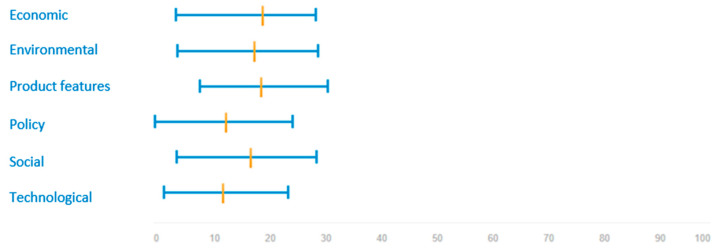
Figure 4.
Weights assigned to each criterion (economic, environmental, features for consumers, policy, social, technological) (%) (all stakeholders’ views). The orange cross-line shows the mean value. The blue horizontal line shows the range between lowest and highest weights attached to each criterion.

