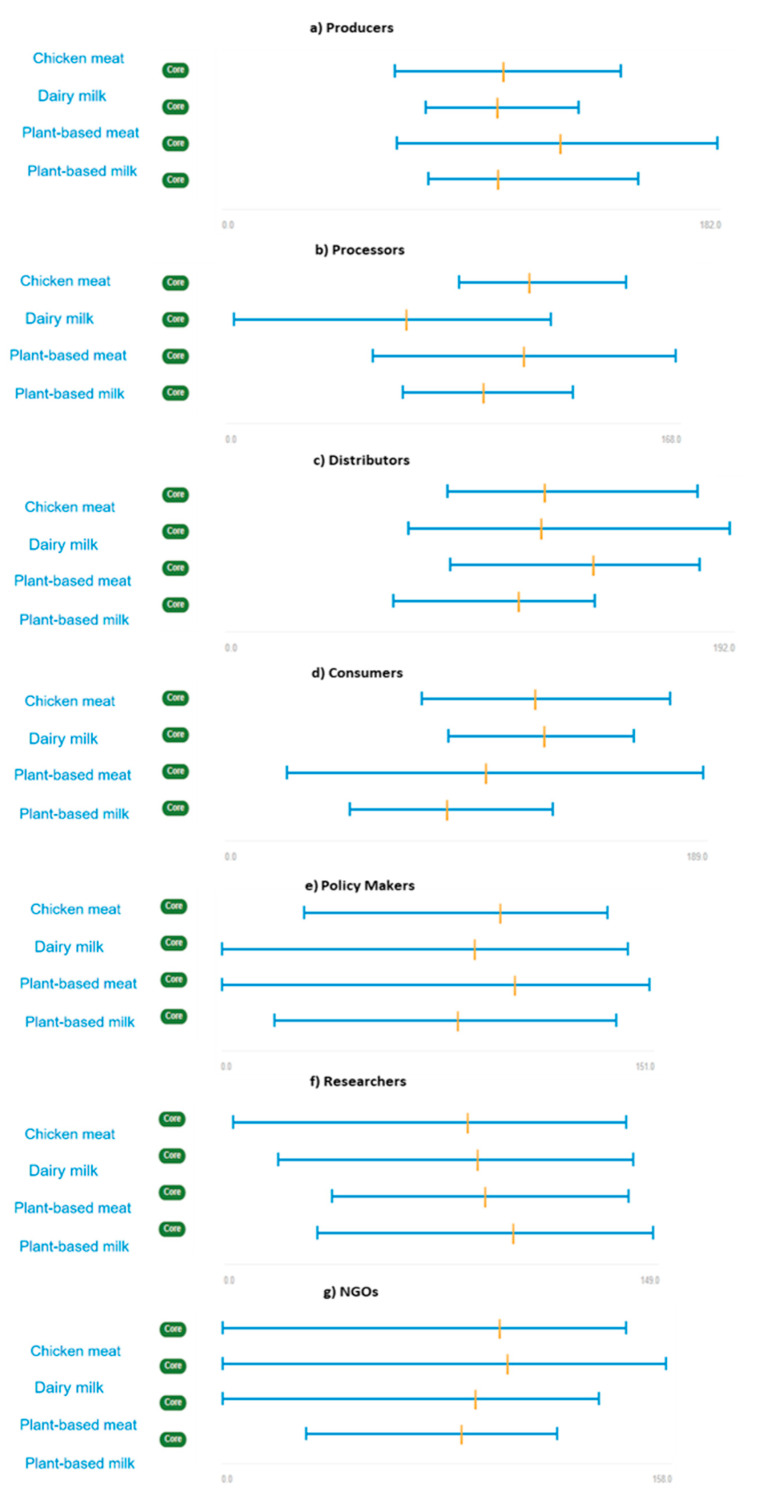
Figure A2.
Uncertainty by stakeholder group: (a) Producers; (b) Processors; (c) Distributors; (d) Consumers; (e) Policymakers; (f) Researchers; (g) NGOs. The orange cross-line represents the average degree of uncertainty. The blue line refers to extreme values (the left and right ends show the largest and lowest degrees of uncertainty).

