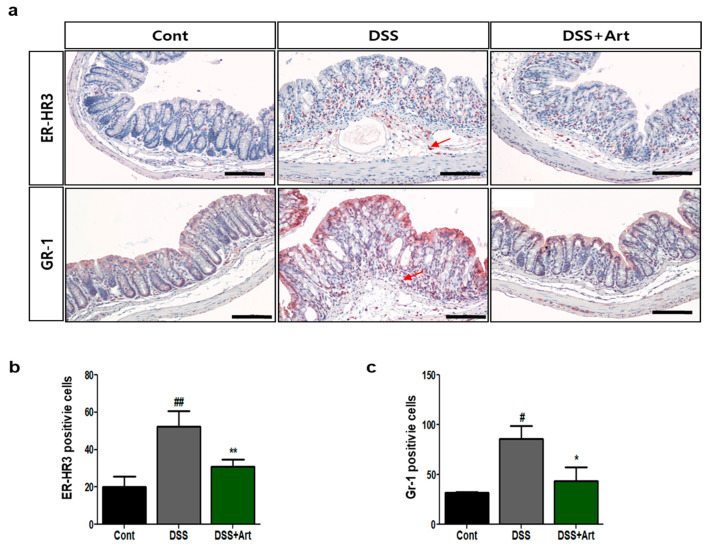
Figure 3.
Immunohistochemical analysis of ER-HR3 and GR-1 staining of colon tissue. (a) Representative images of paraffin-embedded colon sections from control mice (Cont), mice with DSS-induced colitis (DSS), and mice treated with DSS + artemisinin (DSS + Art) after staining with anti-ER-HR3 or Gr-1 antibodies, used to count ER-HR3- and Gr-1-positive cells. The arrow indicates positive cells. Scale bar, 50 μm. (b) Quantification of ER-HR3-positive and (c) Gr-1-positive cells in colon tissue. Data shown are from three independent experiments (five randomly selected fields, ×200) and are expressed as mean ± SD (n = 10 per group); # p < 0.05 and ## p < 0.01 DSS versus Cont; * p < 0.05, ** p < 0.01 DSS + Art versus DSS.2.4. Art reduces the expression of lymphangiogenic factors in the DSS-induced colitis model.

