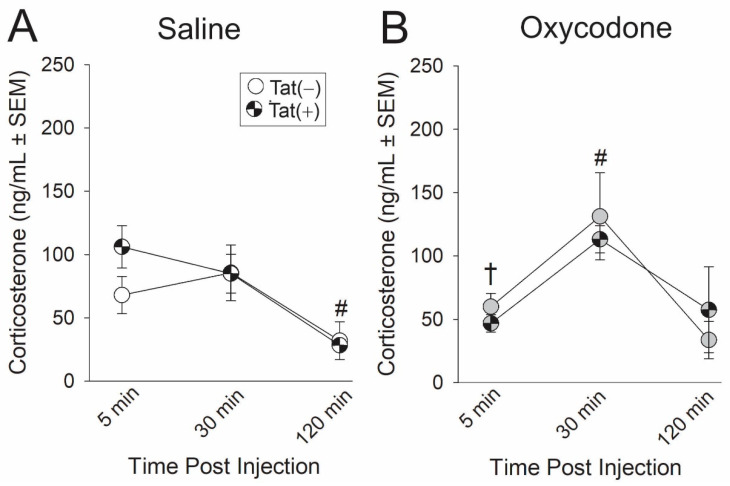
Figure 4.
Tat(−) (see open circles) and Tat(+) (see hatched circles) mice (n = 5/group) were acutely-administered (A) saline (white circles) or (B) oxycodone 3 mg/kg, i.p., (gray circles) and circulating corticosterone was measured from serum collected by tail-bleed at 5, 30, and 120 min post-injection. † indicates an interaction wherein oxycodone-administered mice differ from saline-administered mice at t5; # indicates an interaction wherein the indicated group differs from their respective t5 and t120 time-points, p < 0.05.

