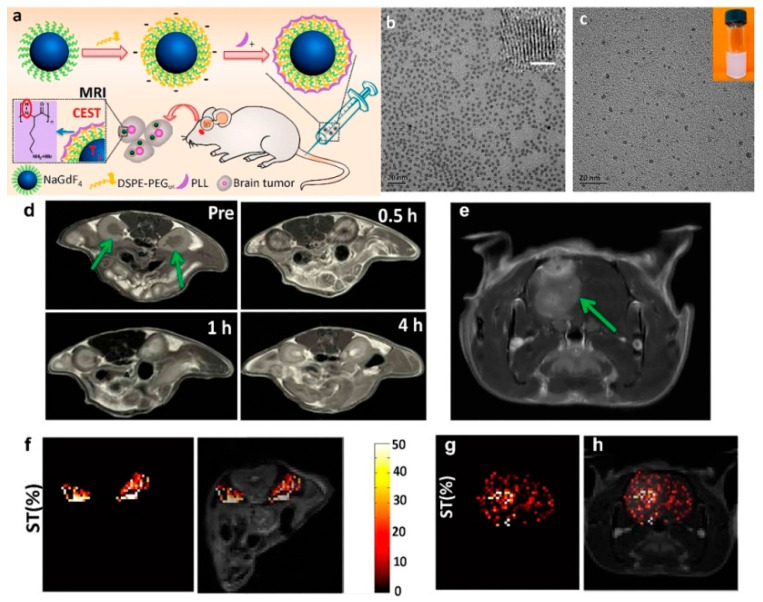
Figure 8.
(a) Schematic representation of the synthesis of NaGdF4@PLL NDs for T1-weighted and chemical exchange saturation transfer (CEST) MR imaging. (b) TEM and HRTEM (inset, scale bar: 1 nm) micrograph oleic acid-coated NaGdF4 NDs in chloroform. (c) TEM micrograph and photograph (inset) of NaGdF4@PLL NDs in water. (d) In vivo T1-weighted MRI of kidneys of mouse (as arrowed) before and after the intravenous administration of NaGdF4@PLL NDs at a dose of 5 mg Gd kg−1. (e) In vivo T1-weighted MRI of brain tumor (as arrowed) after the intravenous administration of NaGdF4@PLL NDs at a dose of 10 mg Gd kg−1. (f) CEST contrast difference map between pre/post-injection following radio frequency (RF) irradiation at 3.0 μT. Only the kidney signal is displayed in color on the grayscale image to highlight the CEST effect. (g) CEST ST difference map between pre/post-injection at 3.0 μT. Only the brain ventricle signal is displayed in color on the grayscale image to highlight the CEST effect. (h) Merged image of (e) and (g) (adapted from Shi et al. 2016 [85], Copyright 2016 the American Chemical Society and reproduced with permission).

