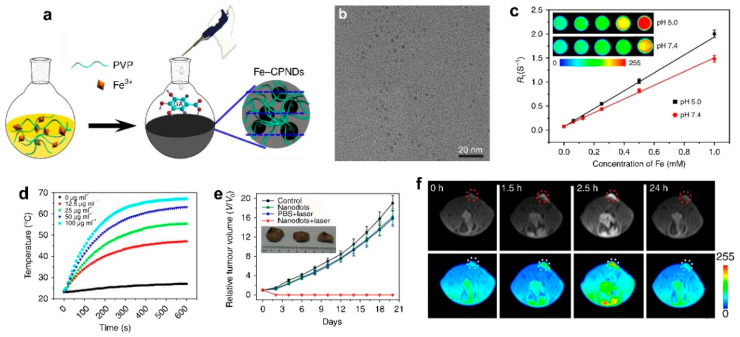
Figure 11.
(a) Schematic representation of the synthesis of Fe-CPNDs. (b) TEM micrograph of Fe-CPNDs. (c) The effect of solution pH on the R1 relaxivity of Fe-CPNDs. (d) Temperature elevation of Fe-CPNDs solutions with various concentrations under 1.3 W cm−2 808 nm NIR laser irradiation for 10 min. (e) Tumor growth curves of different groups of mice after intravenous treatments. The inset shows the digital photographs of tumors collected from different groups of mice at day 20th post-administration. (f) In vivo MR images of the SW620 tumor-bearing nude mouse after intravenous injection of at a dose of 0.25 mg Fe kg−1 (The tumor was marked by circle, which was about 5 mm3 in volume.) after the intravenous injection of Fe-CPNDs at different time intervals (0 h indicates pre-injection) (adapted from Liu et al. 2015 [107], Copyright 2015 Macmillan Publishers Ltd. and reproduced with permission).

