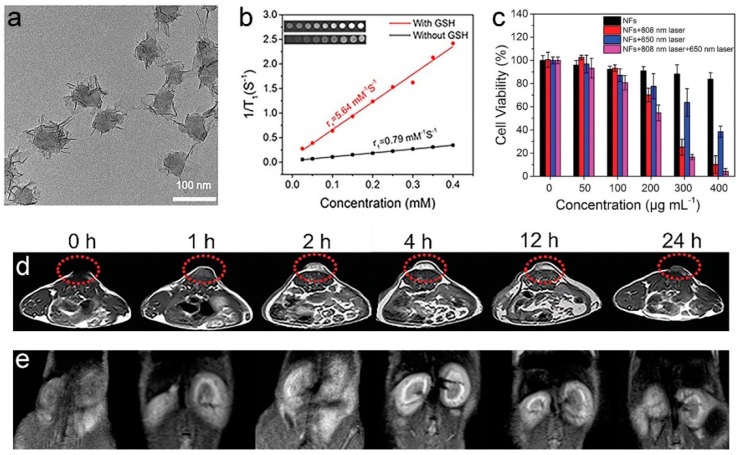
Figure 12.
(a) TEM micrographs of PDA@ut-MnO2/MB NFs. (b) The r1 values of PDA@ut-MnO2/MB NFs with and without 5 mmol L−1 GSH. (c) An assessment of PDT/PTT efficacy using PDA@ut-MnO2/MB NFs via CCK-8 assays. In vivo MR images of HCT 116 tumor-bearing mouse (d) tumor and (e) kidneys different time points after the intravenous injection of PDA@ut-MnO2/MB NFs (0, 1, 2, 4, 12, and 24 h; 0 h means pre-injection) at a dose of 10 mg Mn kg−1 (adapted from Sun et al. 2019 [125], Copyright 2019 The Royal Society of Chemistry and reproduced with permission).

