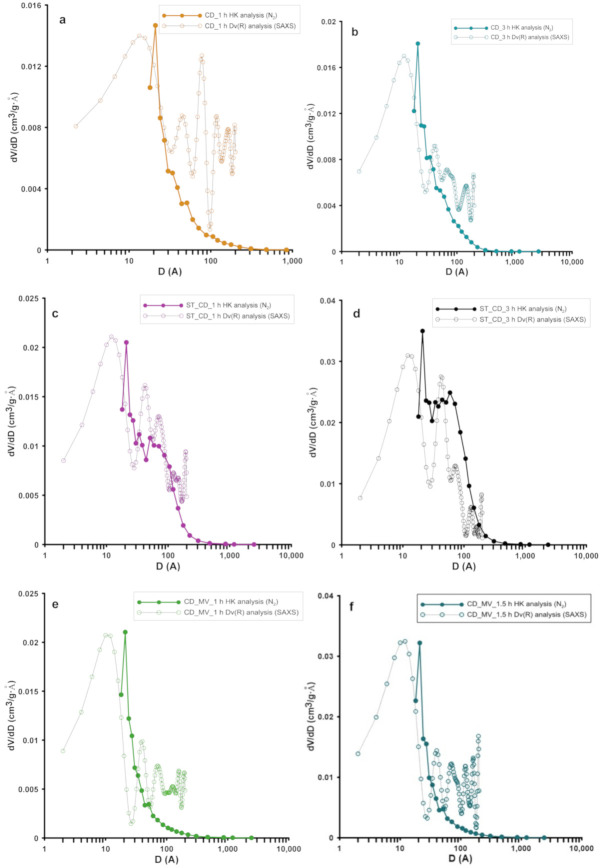
Figure 5.
Calculated volume weighted particle size distributions of the particles from SAXS and comparison with distribution curves determined by HK (N2 adsorption/desorption) for all investigated samples (a–f), (a) CD _1 h, (b) CD_3 h, (c) ST_CD_1 h, (d) ST_CD_3 h, (e) CD_MV_1 h and f) CD_MV_1.5 h.

