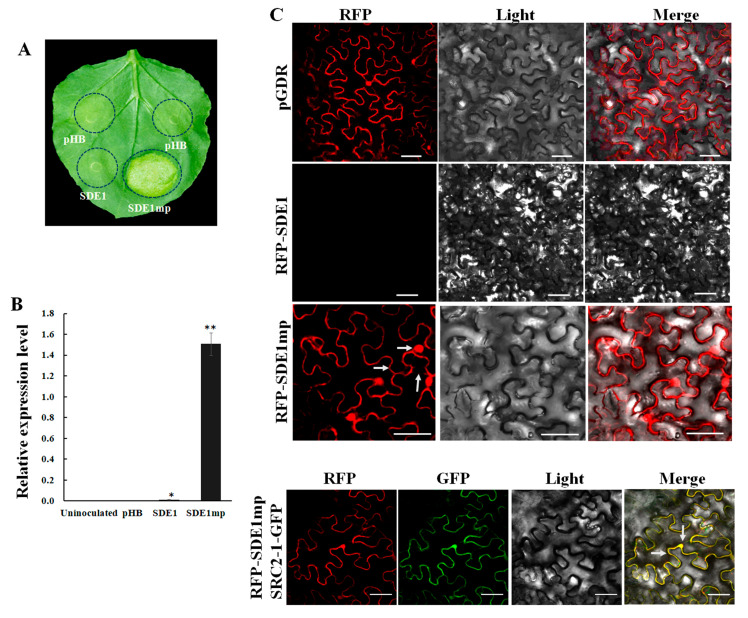
Figure 1.
Expression of SDE1 in N. benthamiana by agroinfiltration. (A) Chlorosis induced by SDE1mp. The phenotype was observed at 3 dpi. (B) qRT-PCR assay of the transcript levels of SDE1 and SDE1mp at 3 dpi. The relative expression levels were normalized to internal control NbEF1a. Asterisks indicate significant differences (* p < 0.05, ** p < 0.01, n = 3). (C) Visualization of RFP-SDE1 and RFP-SDE1mp fusion proteins in N. benthamiana cells. Arrows indicate the localization of RFP-SDE1mp in the cell membrane, cytoplasm, and nucleus. Samples were examined under the microscope at 2 dpi. Bar denotes 50 μm. All experiments were repeated three times.

