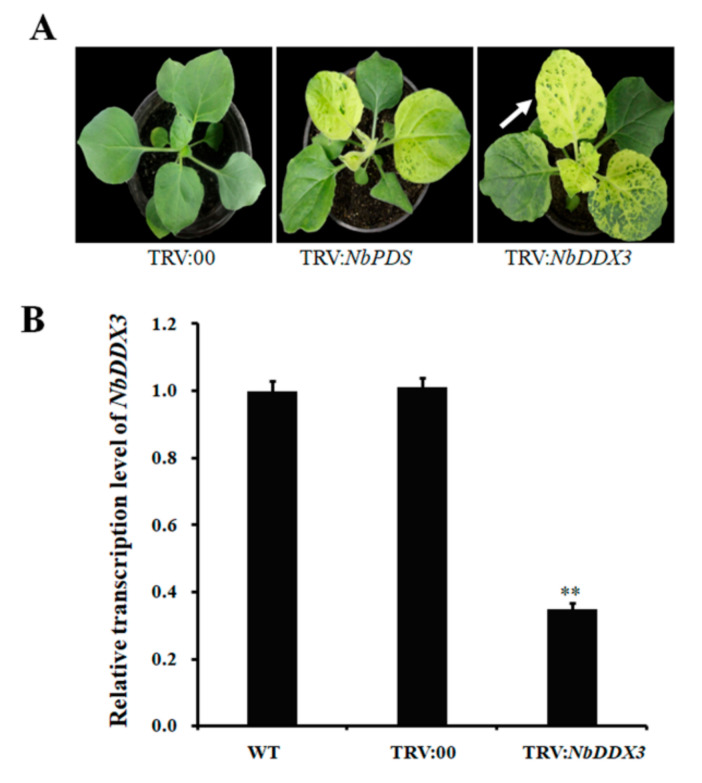
Figure 4.
Silencing of the N. benthamiana NbDDX3 gene. (A) Growth phenotypes of NbDDX3-silenced plants at 15 dpi. White arrows indicate leaf mottling in NbDDX3-silenced plant. (B) qRT-PCR analysis of the transcript level of the NbDDX3 gene at 15 dpi. The expression of NbEF1α was used as an internal control. The expression level in wild type plants was set to “1” and the fold change in silenced plants was calculated by comparison with wild type. Error bars indicate standard deviations, and asterisks denote statistical significance (** p ˂ 0.01, n = 3). All experiments were repeated three times.

