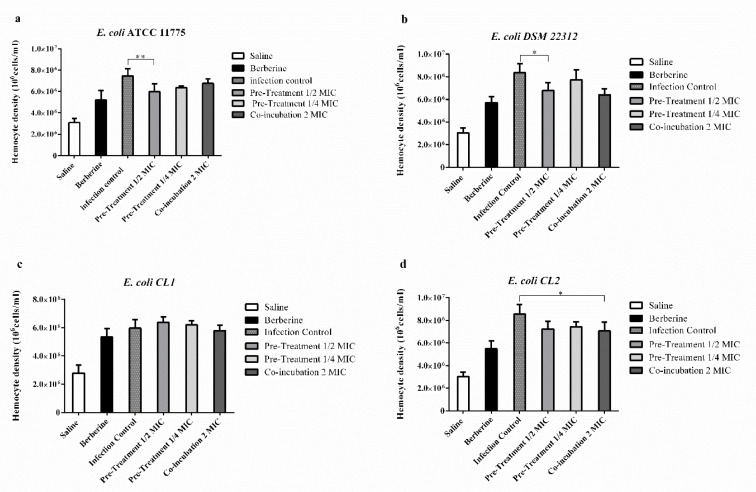
Figure 6.
Hemocyte count of G. mellonella larvae infected with E. coli 105 CFU/larvae and treated with berberine. Larvae treated with: saline (White histograms) or berberine. (Black histograms). Dark grey histograms with small squares: larvae infected with E. coli strains. Light grey histograms: larvae infected with E. coli pre-treated with 1/2 MIC and with 1/4 MIC berberine. Dark grey histograms: larvae infected and co-incubated with berberine. (a) E. coli ATCC 11775. (b) E. coli DSM 22312. (c) E. coli (CA-UTI) CL1. (d) E. coli CL2 (CA-UTI). Results are expressed as cells/mL. The bars represent means ± SD of three independent experiments performed in triplicate. Statistically significant differences, determined by one-way analysis of variance ANOVA (* indicates a significant difference at p < 0.05 versus control/untreated, ** indicates a significant difference at p < 0.01 versus control/untreated).

