Figure 3.
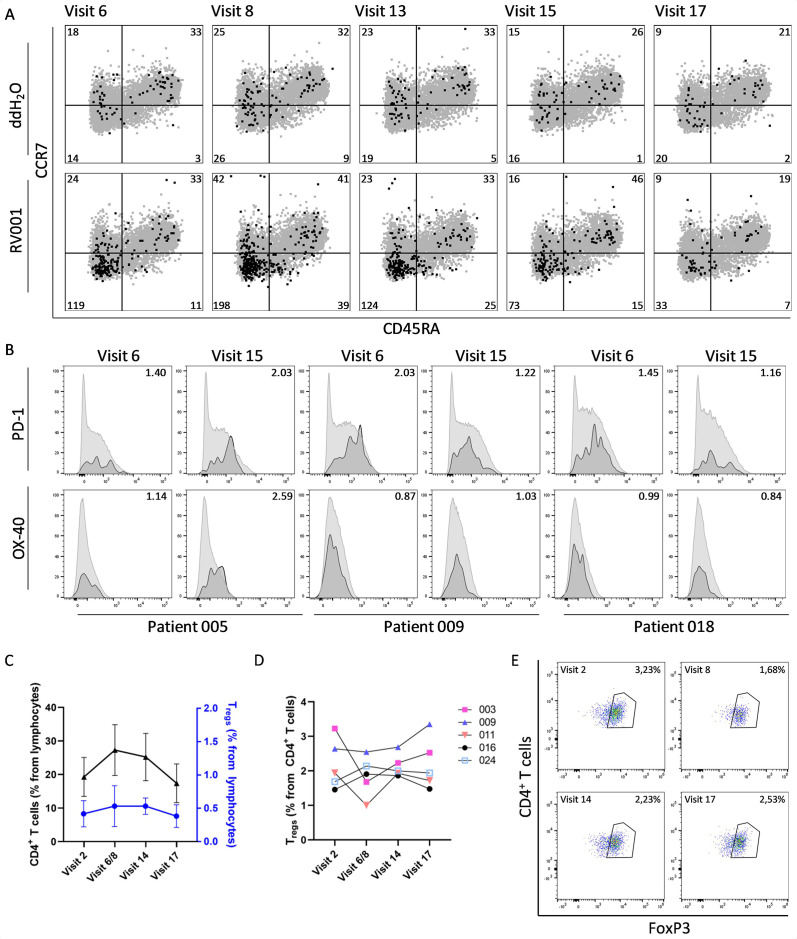
RV001-specific T cells are effector memory T cells. PBMCs from Patient 005 (visits 6–15) and Patients 009 and 018 (visits 6–17) were thawed, rested and stimulated either with RV001 or ddH2O for 12 hours. Live RV001-specific CD4 lymphocytes were identified by TNF expression and examined for the expression of CD45RA, CCR7, PD-1, OX-40, and LAG-3. (A) Exemplary results (Patient 009): CD4+TNF+ cells (black) are overlaid on the whole CD4 cell population (gray). Numbers indicate CD4+TNF+ cell counts. (B) Expression profile of PD-1 (upper row) and OX-40 (lower row) for n=3 patients at visit 6 and visit 15. Numbers indicate MFI ratios of the two receptors between CD4+TNF+CD45RA-CCR7- cells (dark gray) and CD4+TNF-CD45RA-CCR7- cells (light gray). Histograms show event counts normalized to mode. (C–E) Assessment of Tregs (CD3+CD8-CD4+CD127-CD25+Foxp3+) from 5 patients (4 visits). (C) Mean+95% CI of total CD4 cells (left-axis, black curves) and Tregs (right axis, blue curves) within lymphocytes. (D) Kinetics of Treg percentages within CD4 T lymphocytes for each of the 4 patients. (E) Exemplary dot-plots for Patient 003, percentages of CD3+CD8-CD4+CD127-CD25+Foxp3+ cells are indicated. ddH2O, deionized water; MFI, median fluorescence intensity; TNF, tumor necrosis factor.

