Figure 1.
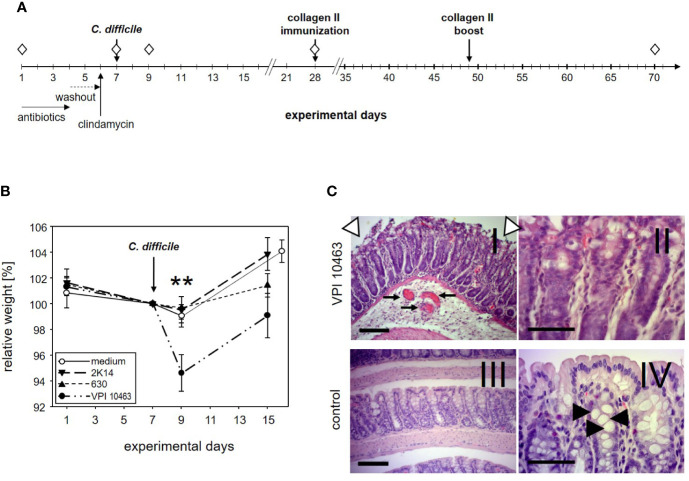
DBA/1J × B10.Q F1 mice are susceptible to Clostridioides difficile infection. (A) Experimental setup of C. difficile infections. (B) Mean (± SEM) relative weight curves of mice gavaged with bacterial growth medium (n = 14) and infected mice (630: n = 19, 2K14: n = 16, VPI10463: n = 16). Asterisks denote statistically significant (**p-value = 0.0033) weight differences between experimental groups. (C) H&E stained 4 µm sections of colonic tissue depict erosive colitis on day 2 after infection with “summit lesions” (compare open arrowheads in I to edge of mucosal layer in IV), reduced numbers of vesicles (compare II and arrowheads in IV), thickened submucosal layer with inflammatory infiltrates, and capillary vessels in I (arrows). Scale bars represent 100 µm (I and III) and 50 µm (II and IV), respectively.

