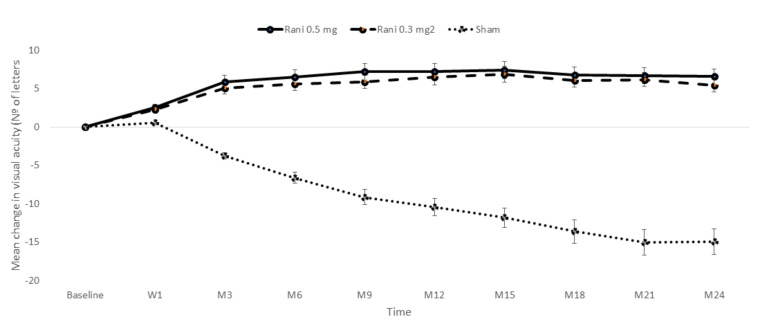
Figure 4.
Mean (±SE) changes in the visual acuity from baseline through 24 months observed in the MARINA study. As compared to the sham injection group, the mean visual acuity was significantly greater in each of the ranibizumab groups at each month during the study follow-up (p < 0.001). At week 1, On day, p = 0.006 for patients receiving ranibizumab 0.3 mg and p = 0.003 for those receiving ranibizumab 0.5 mg. Adapted from Rosenfeld et al. [89]. W: Week; M. Month; Rani: Ranibizumab.

