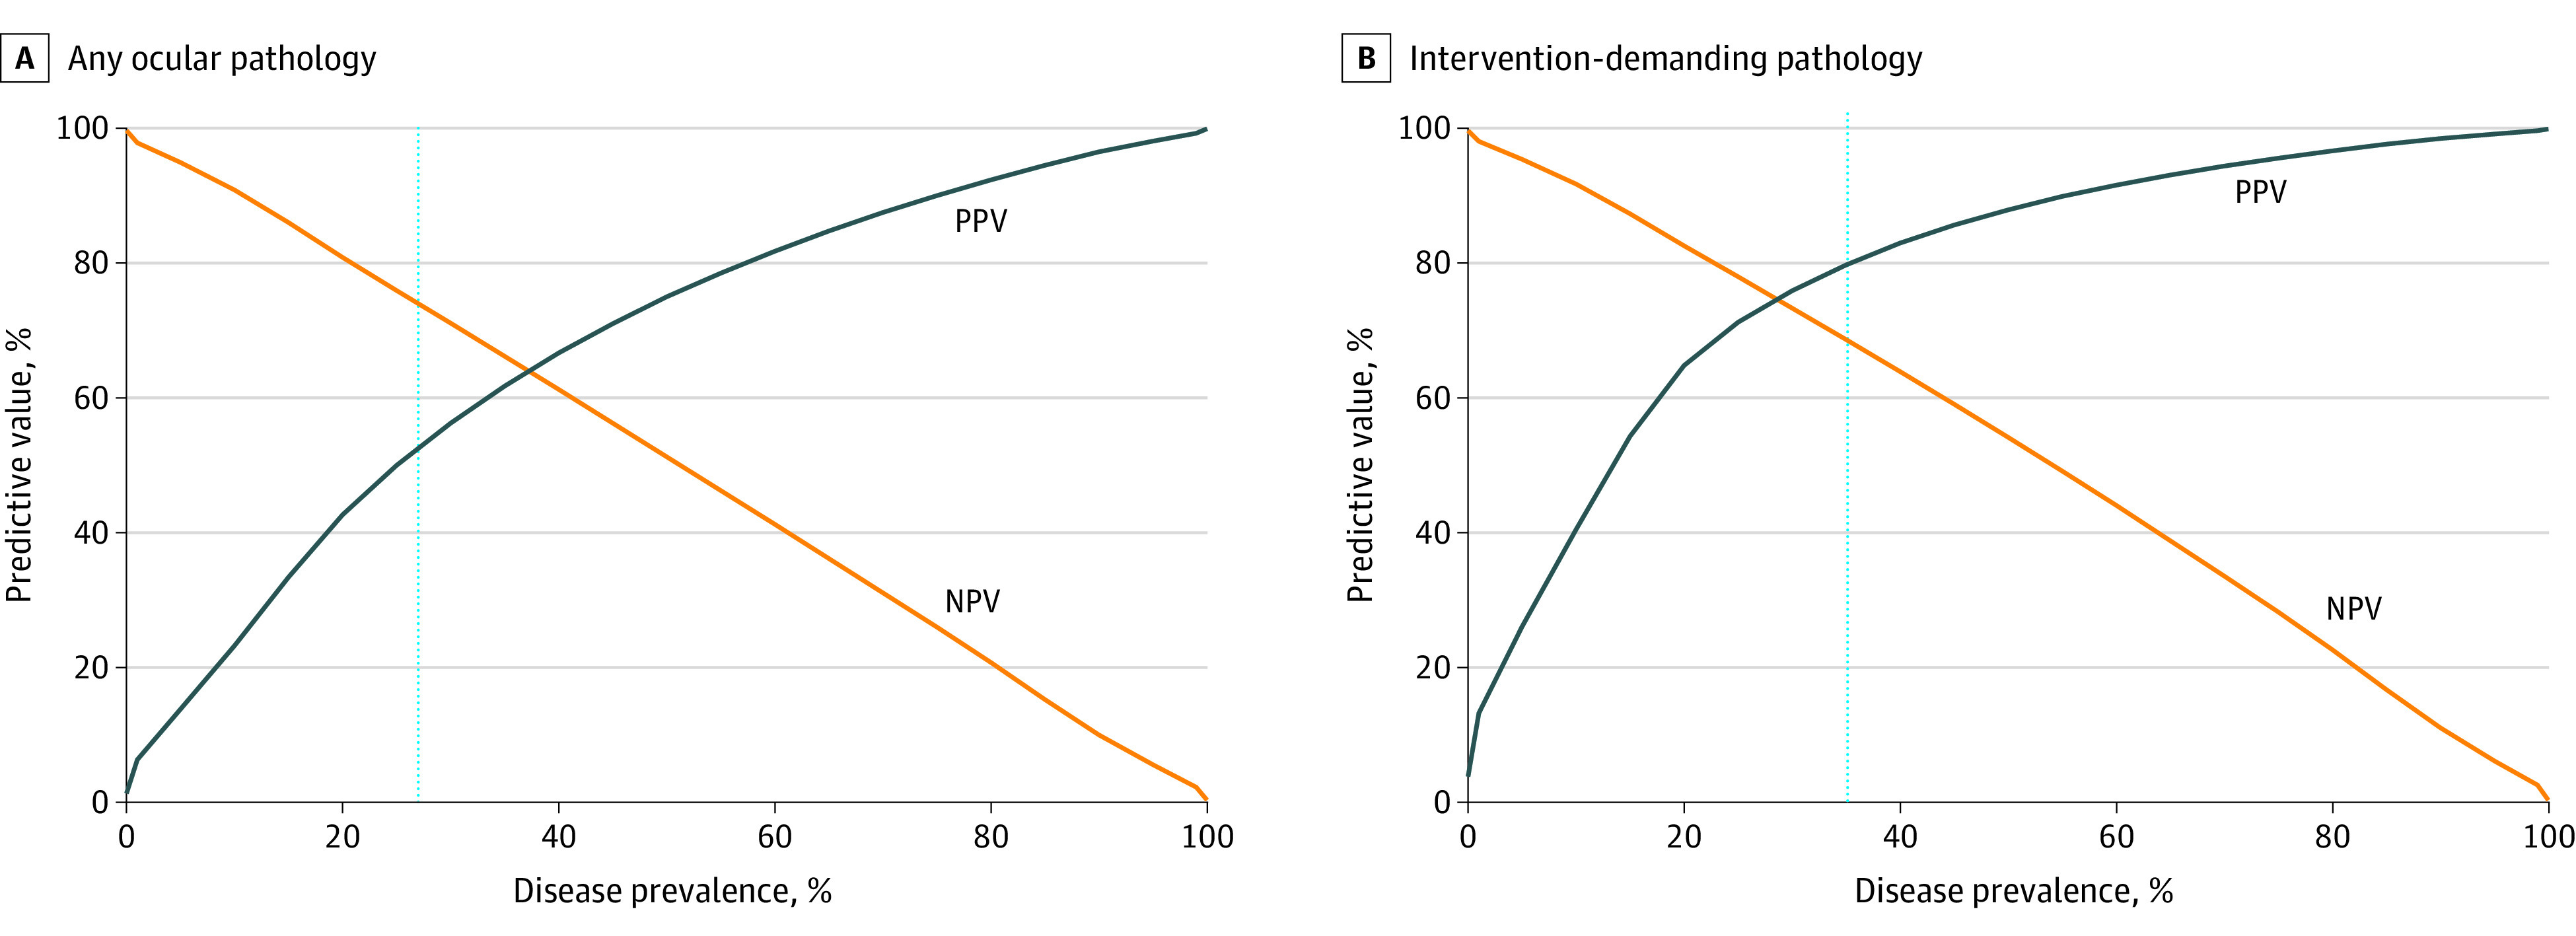
Figure 2. Performance Evaluation of the Red Light Reflex for Detection of Ocular Pathologies.

Based on summary estimates of the diagnostic test accuracy, we plotted the association between the disease prevalence (x-axis) and the positive predictive value (PPV, ie, percentage with disease given that the test result is positive) and the negative predictive value (NPV, ie, percentage not having disease given that the test result is negative) (y-axis). The dotted line shows the calculated prevalence among infants of any ocular pathology (A) and any medical or surgical intervention–demanding ocular pathology (B).
