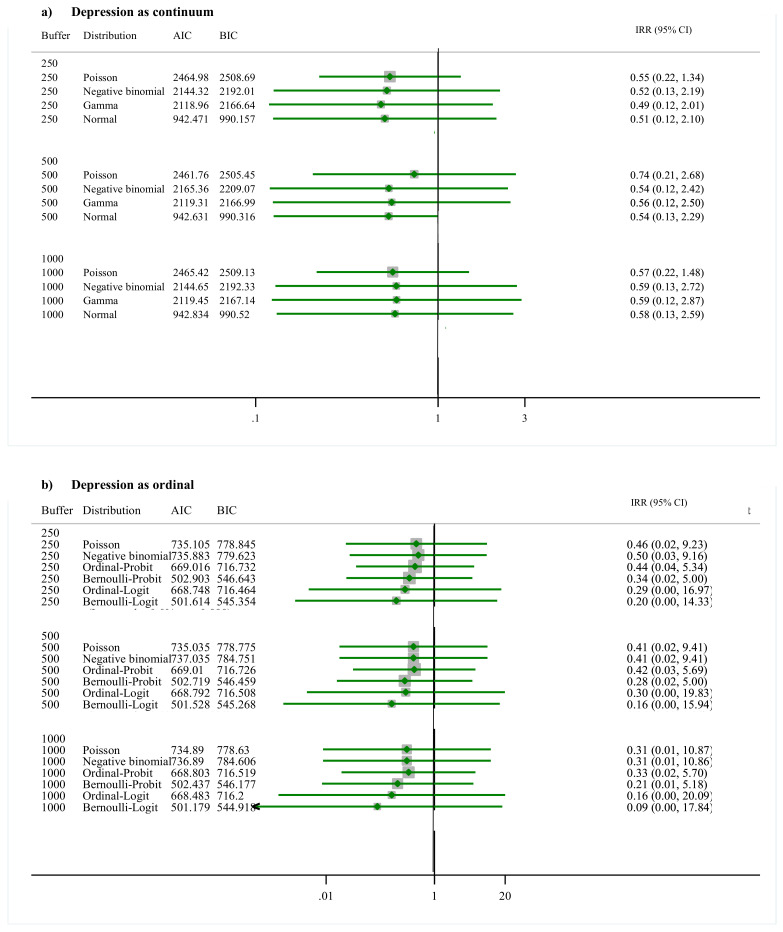
Figure 1.
Direct association between depression (a) continuum and (b) ordinal variable and greenness summarized at buffer sizes of 250 m, 500 m, and 1000 m. Note: Buffer indicates distances in meters around the geocoded address of residence of each study participant. Distribution indicates the distribution in which depression was modeled. When the normal distribution was assumed, the values of depression were log transformed. AIC corresponds to the Akaike information criterion results and BIC to the Bayesian information criterion results. IRR are incidence rate ratios. CI is confidence interval. All models were adjusted by Age, Sex, Healthy-food index, Physical-Activity index, Body mass index, Household income, Adverse Childhood Experiences, Social support index, and Peer alienation index.

