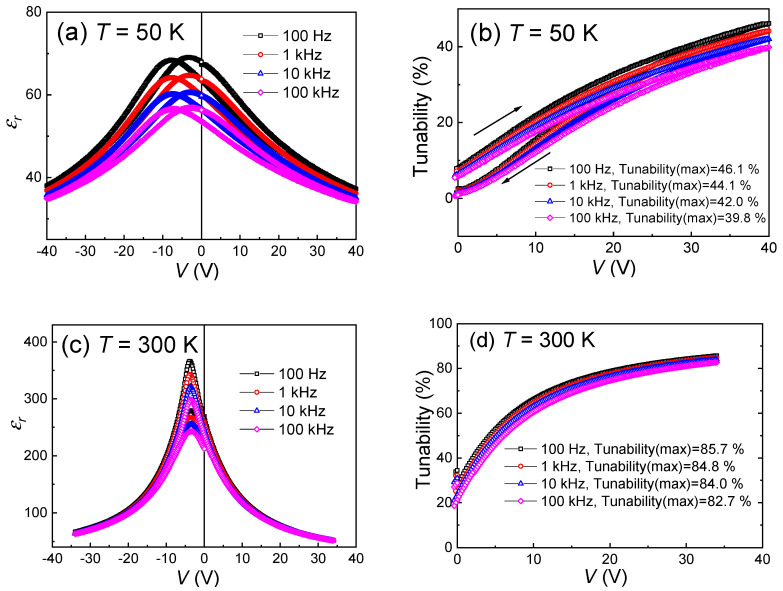
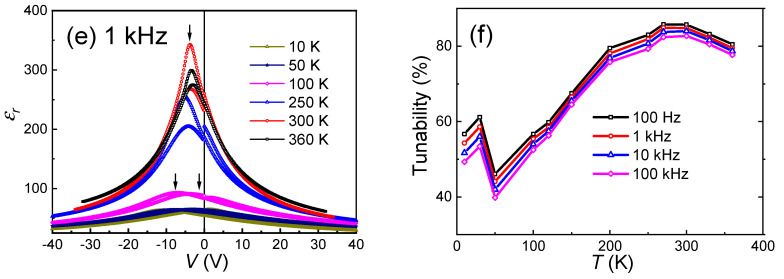
Figure 7.
The temperature- and frequency-dependent curves and calculated tunability values: (a) the curves at different frequencies measured at 50 K; (b) tunability values at 50 K; (c) the curves at different frequencies measured at 300 K; (d) tunability values at 300 K; (e) the temperature-dependent curves measured from 10 K to 360 K at 1 kHz; (f) the tunability values as a function of temperature from 10 K to 360 K, measured at a frequency range from 100 Hz to 100 kHz.


