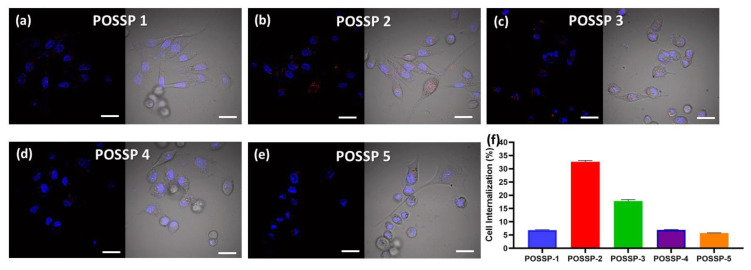
Figure 4.
Confocal micrographs of MDA-MB-231 cells inoculated with POSSPs 1–5, respectively (a–e). The cell nuclei are observed in the blue channel after staining with Hoechst 33342. The fluorescence in the red channel shows the presence of POSSPs. The merged micrographs show the of POSSPs inside MDA-MD-231 cells. Scale bar, 30 μm. The internalization of POSSPs 1 (blue), 2 (red), 3 (green), 4 (purple) and 5 (orange) in MDA-MB-231 cells was quantified using flow cytometry (f).

