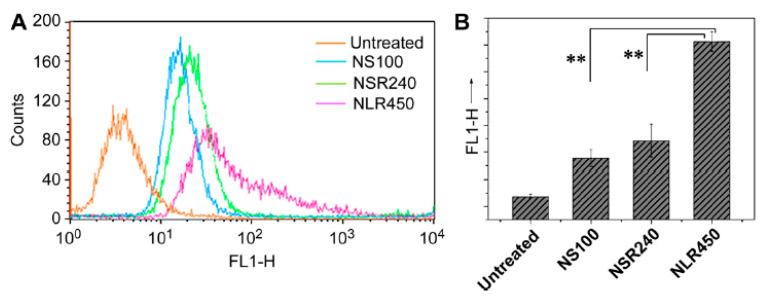
Figure 2.
Quantification of the internalization of mesoporous silica NPs: fluorescence intensity (A), particle numbers (B), using fluorescent-activated cell sorting (FACS). ** Indicates statistical significance, p < 0.01). Reprinted with permission from [70]. Copyright 2010 Elsevier.

