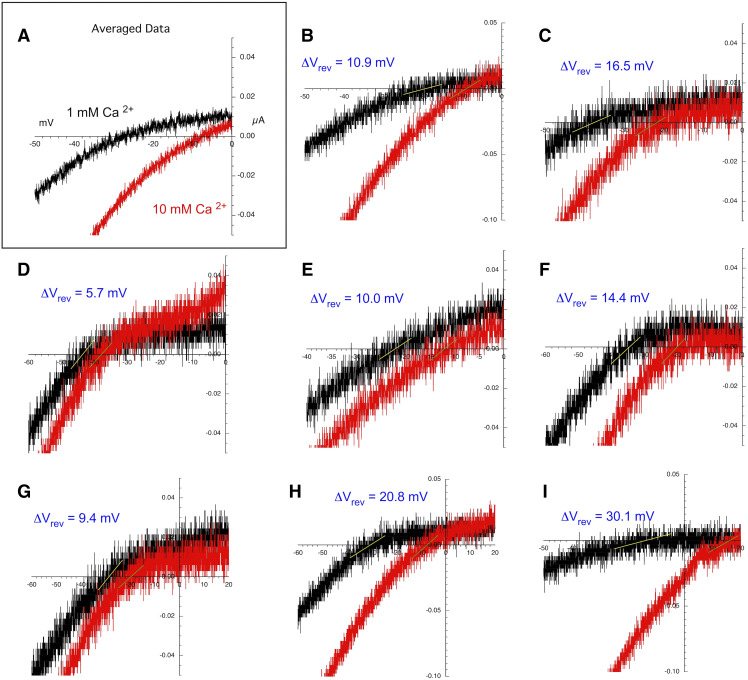
Fig. 3.
Expanded scale of current-voltage curves for 30 µM ACh-evoked responses close to the reversal potentials. (A) Expanded scale of the averaged data from Fig. 2. (B–I) Current-voltage curves on expanded scales for each of the eight replicates that were used to calculate the average shown in (A). Calculated reversal potential shifts for each replicate are shown in each panel. This same procedure was applied to all the PAM-potentiated currents to generate the single cell reversal potential shifts that were used to calculate the average values in Table 2.

