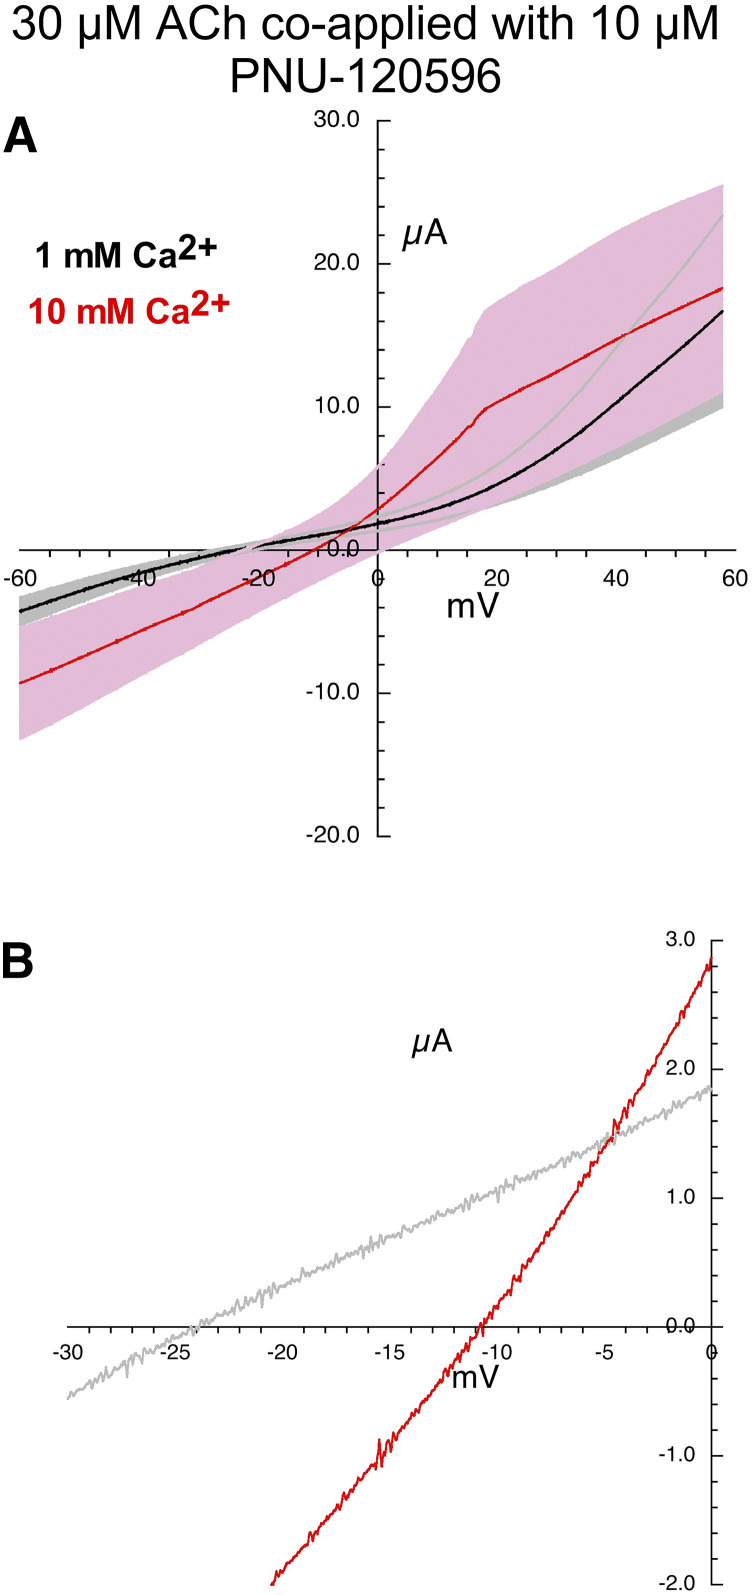
Fig. 4.
Current-voltage curves for α7 nAChR responses evoked by the coapplication of 30 µM ACh and 10 µM PNU-120596. (A) Averaged responses obtained during 1-second voltage ramps applied during the coapplications in the presence of chloride-free Ringer’s solution with either 1 (black line) or 10 mM calcium (red line). The gray and pink bands represent ± S.E.M. of the averaged data calculated at each point for the 1 and 10 mM experiments, respectively. The receptor-mediated responses were calculated by subtracting the currents produced by ramps delivered during the application of control chloride-free Ringer’s solution (either 1 or 10 mM calcium) from the responses during the voltage ramps while drugs were applied. (B) Expanded scale of average current-voltage curves for 30 µM ACh and 10 µM PNU-120596–evoked responses close to the reversal potentials. Data for the individual replicates are provided in Supplemental Fig. 1.

