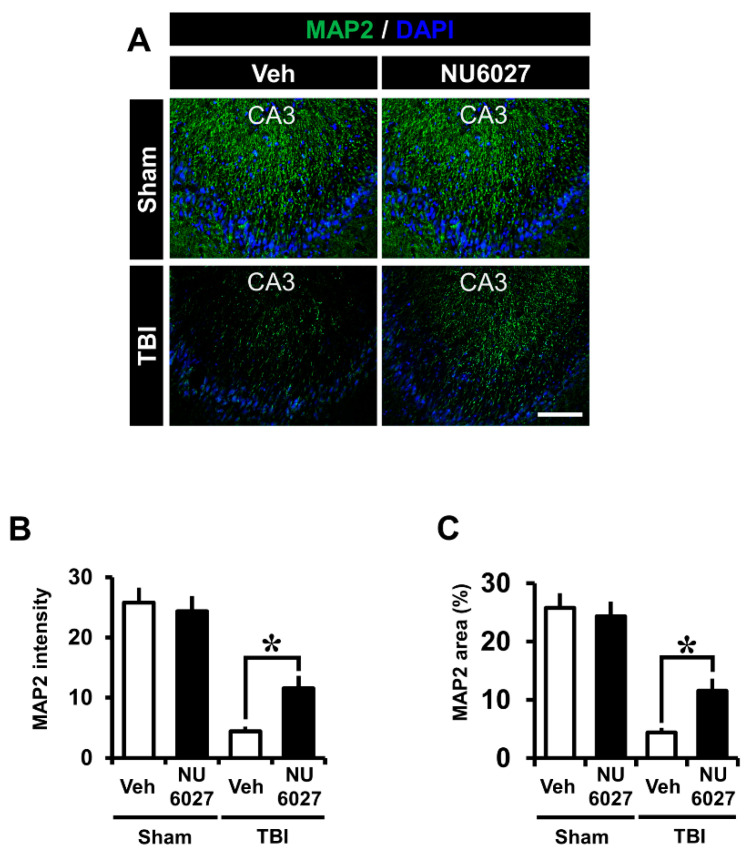
Figure 2.
(A) Fluorescent images microtubule displays were detected by microtubule-associated protein 2 (MAP2, green color) staining from the hippocampal CA3 regions 24 h after TBI. NU6027 post-treatment decreased the intensity of microtubule loss in the hippocampal CA3 region when compared to the vehicle-treated group. (B) The intensity of dendritic loss in the hippocampal CA3 region. The fluorescence intensity displayed a significant difference between groups. (C) The bar graph shows the dendritic area percentage in the hippocampal CA3 region (sham-vehicle, n = 5; sham-NU6027, n = 5; TBI-vehicle, n = 6; TBI-NU6027, n = 6). Data are mean ± S.E.M. * Significantly different from the vehicle-treated group, p < 0.05.

