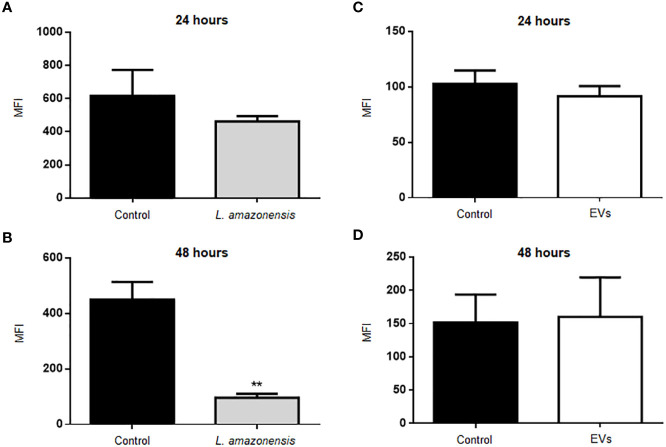
Figure 4.
Production of ROS in B-1 cells after 24 or 48 h of stimulation with L. amazonensis promastigotes (left panel) or the parasites EVs (right panel). (A) infection for 24 h with L. amazonensis promastigotes, (B) 48 h of stimulation with the parasite, (C) 24 h of stimulation with EVs, and (D) 48 h of stimulation with EVs. Total peritoneal cells were collected and labeled with anti-CD19 coupled with APC, anti-CD23 coupled with PE, and H2DCFHDA. Data acquisition analyzes were performed using a FACSCalibur cytometer, followed by analyzes in FlowJo software. The graphs represent the median fluorescence intensity (MFI) for the H2DCFHDA probe in CD19+CD23- gating cells. The bars represent the mean of the duplicates, and the error bars the standard deviation. The graph is representative of two independent experiments. Test t-student, **P < 0.01.

