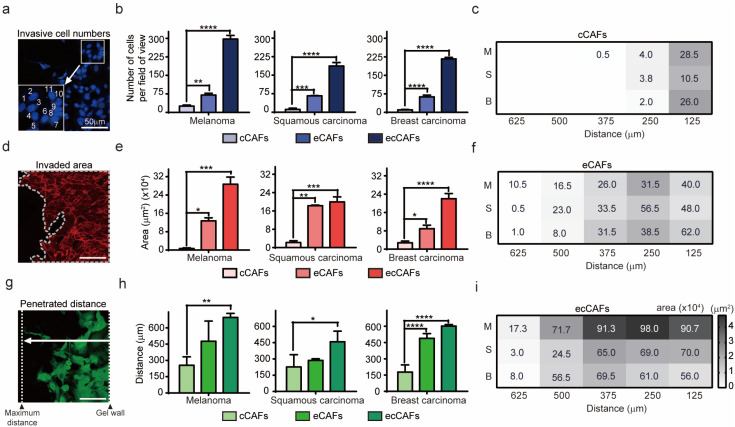
Figure 1.
Physiological evidence of CAF-induced invasion. (a,d,g) Schematic diagram showing the measurement analysis process of cancer cell invasion. Scale bar: 50 μm. (b,e,h) Comparison of the number, distance, area and invasiveness of the three different cancer cell types. (c,f,i) Analysis of invasiveness based on area of invasive cells in relation to distance travelled into the ECM matrix. Larger areas are represented by darker color. The numbers indicate the degree of invasiveness of cells (M: Melanoma; S: Squamous carcinoma; B: Breast carcinoma). Data are presented as means ± SEM (* p-value < 0.05, ** p-value < 0.01, *** p-value < 0.001, **** p-value < 0.0001).

