Figure 3.
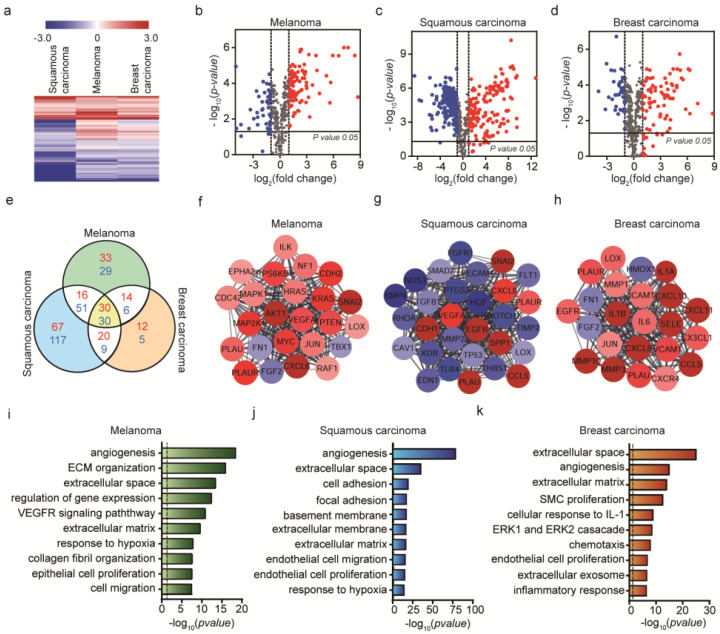
Identification of differentially expressed genes from cCAFs and their biological functions. (a) Hierarchical clustering of expression profiles of differentially expressed mRNAs among the three cell lines (p < 0.05). Red color indicates high relative expression and blue indicates low relative expression. (b–d) Volcano plot showing gene expression differences among the three cell lines, with red representing DE genes with log2 (fold change) > 1 and blue representing DE genes with log2 (fold change) < −1. (e) Venn diagram showing the significant gene numbers for the three cancer cell lines. Red represents log2 (fold change) > 1 and blue log2 (fold change) < −1. Comparison of DE gene expression levels with cCAFs and HUVECs. (f–h) Top module of the protein–protein interaction (PPI) network for densely connected nodes. Red, DE genes with log2 (fold change) > 1; blue, DE genes with log2 (fold change) < −1. Larger node size represents more significant p-values. (i–k) Gene ontology (GO) term enrichment analysis of mRNA expression in B16BL6, A431 and MDA-MB-231 cells (p-value < 0.05, | log2 (fold change) | > 1). The dashed line signifies a p-value of 0.05.

