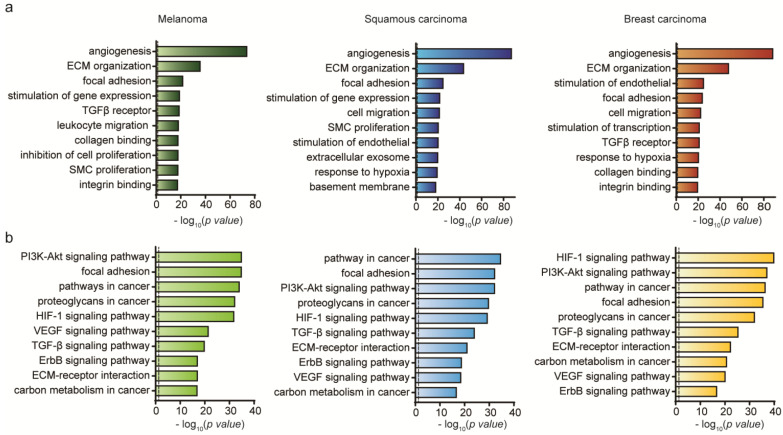
Figure 5.
Comparative expression profiling of cancer invasion between ecCAFs and cCAFs. (a) Gene ontology (GO) term enrichment analysis of differentially expressed mRNAs in B16BL6, A431 and MDA-MB-231 cells (p-value < 0.05, | log2 (fold change) | > 1). (b) KEGG pathway analysis of differentially expressed mRNAs in B16BL6, A431 and MDA-MB-2321 cells (p-value < 0.05, |log2 (fold change)| > 1). The dashed line signifies a p-value of 0.05.

