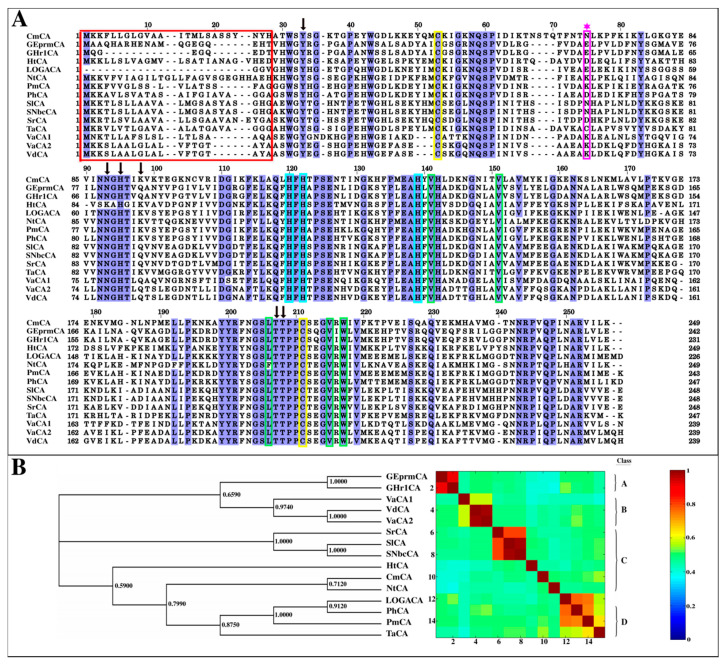
Figure 2.
Multiple sequence alignment (MSA) and phylogenetic tree of retrieved α-CA sequences calculated by Tree-based Consistency Objective Function for Alignment Evaluation (T-Coffee) and MEGA7, respectively. (A): The red box indicates the signal peptide residues removed during modelling. Proton transfer residues are indicated by the arrows above them and the other functional residues are color coded: cyan—Zn2+ coordinating residues; green—CO2 binding pocket residues; yellow—Cys–Cys disulfide bond residues. The magenta star indicates the Cys position in TaCA responsible for its tetramerization. (B): The evolutionary relationship amongst the 15 retrieved sequences was inferred using the Maximum Likelihood method under the WAG + G + I model and a 100% gap deletion. Bootstrap values from 1000 bootstrap replicates are shown as decimals at their respective nodes. The heat map for the all-versus-all pairwise sequence identity calculations, generated using the T-Coffee MSA, is displayed next to the phylogenetic tree with the magnitude of identity between sequences increasing from 0, shown by the blue color, to 1, shown by red. Classes A, B, C and D indicate the bacteria classes Deltaproteobacteria, Gammaproteobacteria, Campylobacteria and Aquificacea, respectively.

