
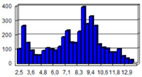
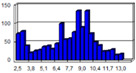
Table 2.
Statistics for points reduced with the TBDRed method based on the LNG port area.
| Raw Dataset | Reduced Dataset for Setting No. 1 | Reduced Dataset for Setting No. 2 | Reduced Dataset for Setting No. 3 | |
|---|---|---|---|---|
| No.P | 2m670,449 | 4096 | 1320 | 426 |
| FD |

|
|
|

|
| MinD | 2.49 | 2.49 | 2.49 | 2.49 |
| MaxD | 15.17 | 13.55 | 13.35 | 13.32 |
| MeanD | 7.30 | 7.91 | 7.79 | 7.99 |
| SD | 2.64 | 2.71 | 2.70 | 2.64 |
| RLev | --- | 99.85 | 99.95 | 99.98 |
No.P—number of points, FD—frequency distribution, MinD—minimum depth (m), MaxD—maximum depth (m), MeanD—mean depth (m), SD—standard deviation, RLev—data reduction level (%).