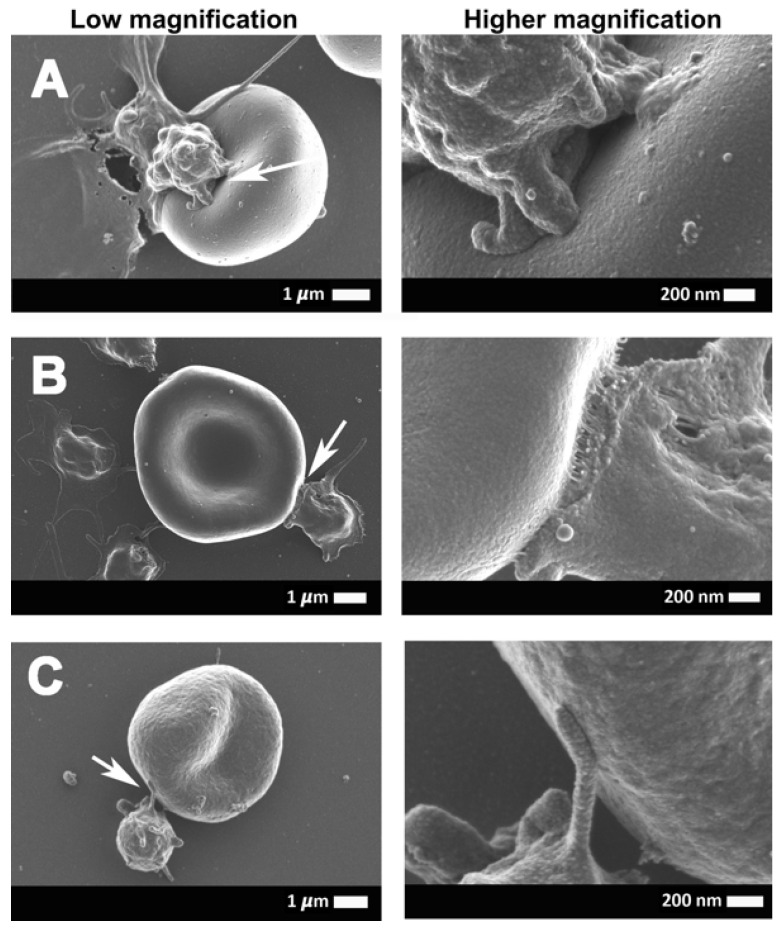
Figure 5.
(A–C) A continuation of the representative scanning electron micrographs of the interaction between the erythrocytes and platelets of COVID-19-positive patients. (A–C) (column on the left) shows the low magnification micrographs of the platelet-erythrocyte interactions, with the corresponding high magnification micrographs (column on the right) to show the ultra-structures of the interactions. Arrows point to the area that was focused on.

