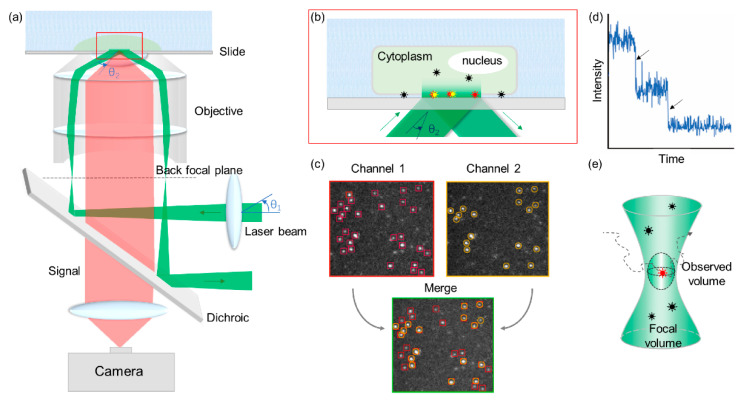
Figure 3.
(a) Schematic of the total internal reflection fluorescence microscopy (TIRFM) and variable-angle (VA)-TIRFM layout. A focused laser beam (green) is reflected at the back of the objective focal plane, passed through the objective lens, and totally internally reflected. The signal (red) passes through the dichroic and is captured on a camera. By changing the angle of the laser beam (θ1), the incident angle (θ2) is variable and converts TIRFM to VA-TIRFM. (b) Enlarged view of the total reflection area in the sample and slide surface. Fluorophores within the evanescent filed field (approximately 100 nm) were excited (red and yellow). (c) Schematic representation of CoSMoS. If fluorophore-s labeled target proteins associate with each other, positions of spots in each channel (red box in channel 1 and yellow circle in channel 2) can be overlaid in the merged image. (d) An example of the double-step bleaching event trajectory. (e) Schematic representation of fluorescence correlation spectroscopy/fluorescence cross-correlation spectroscopy (FCS/FCCS) and photon counting histogram (PCH). The diffusion of fluorophore-labeled molecules in and out of the observed volume induces fluctuations in fluorescence with time. Their diffusion parameters and number of particles can be obtained by fitting the fluorescence fluctuation curve to an adequate diffusion model.

