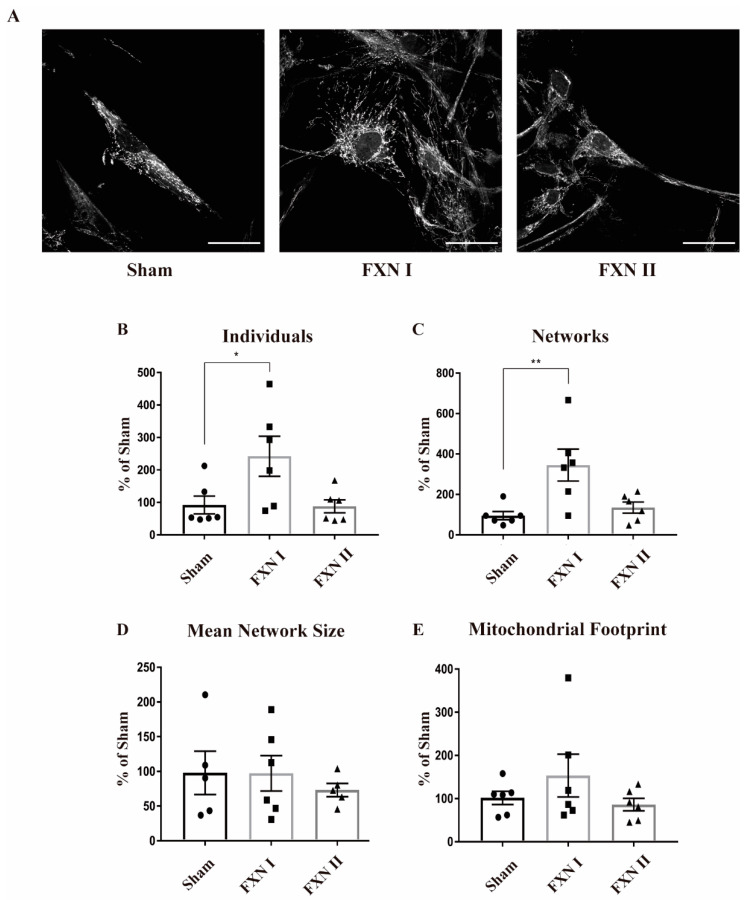
Figure 3.
Mitochondrial network analysis in OEMS FRDA patient cells after lentiviral transduction with frataxin isoforms. All cells were stained with Mitotracker and then analyzed by MiNA (Fiji). (A) OE-MS patient cells either left non-transduced (left), or transduced with Lv-FXN I (middle) or Lv-FXN II (right) and stained with Mitotracker. Calibration bar represents 50 µm. (B) to (E) Analysis and quantification of OE-MSc mitochondrial network morphology with MiNA. (B) Percentage of raw number of individual mitochondria. (C) Percentage of mitochondria arranged in a networked junctioned structure. (D) Number of branches per knot. (E) Total mitochondrial footprint, indicating the quantity of signal versus background in the image. Data represents mean ± SEM of at least three independent cell culture preparations (n = 3). Data were analyzed by one-way ANOVA test with post hoc Dunnett multiple comparisons test. * p < 0.05; ** p < 0.01.

