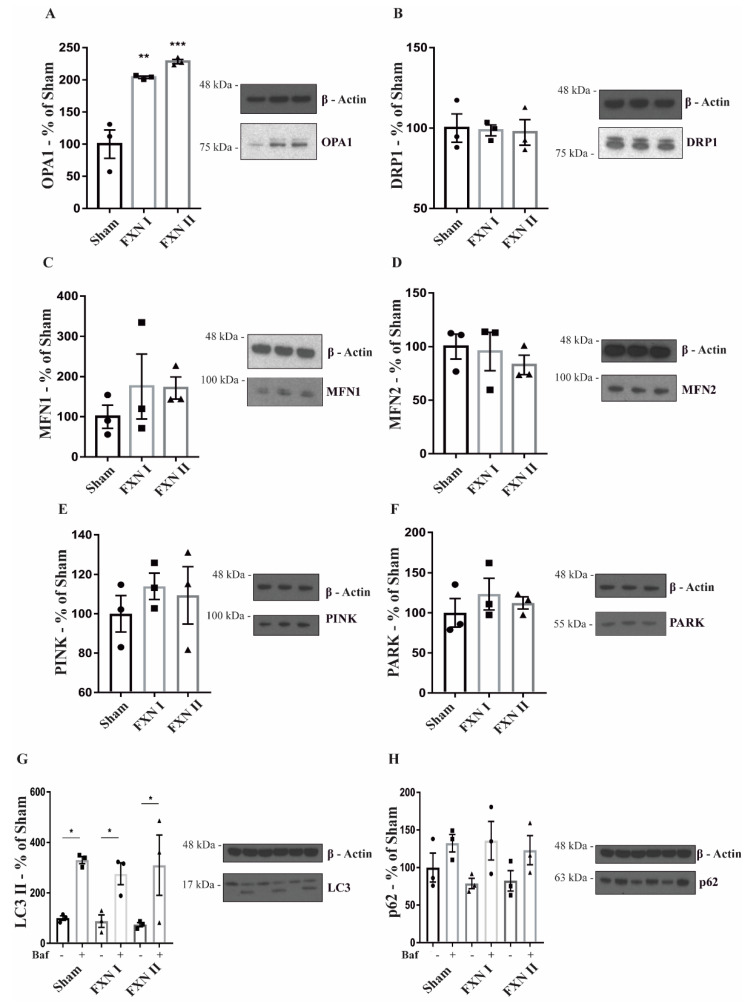
Figure 5.
Western blot analysis of mitochondrial dynamics and quality control-related proteins in OE-MS cells. Cells were either left untransduced (Sham) or transduced with Lv-FXN I or Lv-FXN II. (A) Analysis of OPA1 levels in OE-MS patient cells. (B) Analysis of DRP1 levels in OE-MS patient cells. (C) to (D) Analysis of MFN1 and MFN2 levels in OE-MS patient cells. (E) to (F) Analysis of PINK/PARK levels in OE-MS cells. (G) to (H) Analysis of LC3 and p62 levels with and without autophagy inhibitor bafilomycin A1. Data are represented as mean ± SEM and were analyzed with a one-way ANOVA with post hoc Dunnett multiple comparisons test with n = 3. * p < 0.05; ** p < 0.01; *** p < 0.001.

