Figure 7.
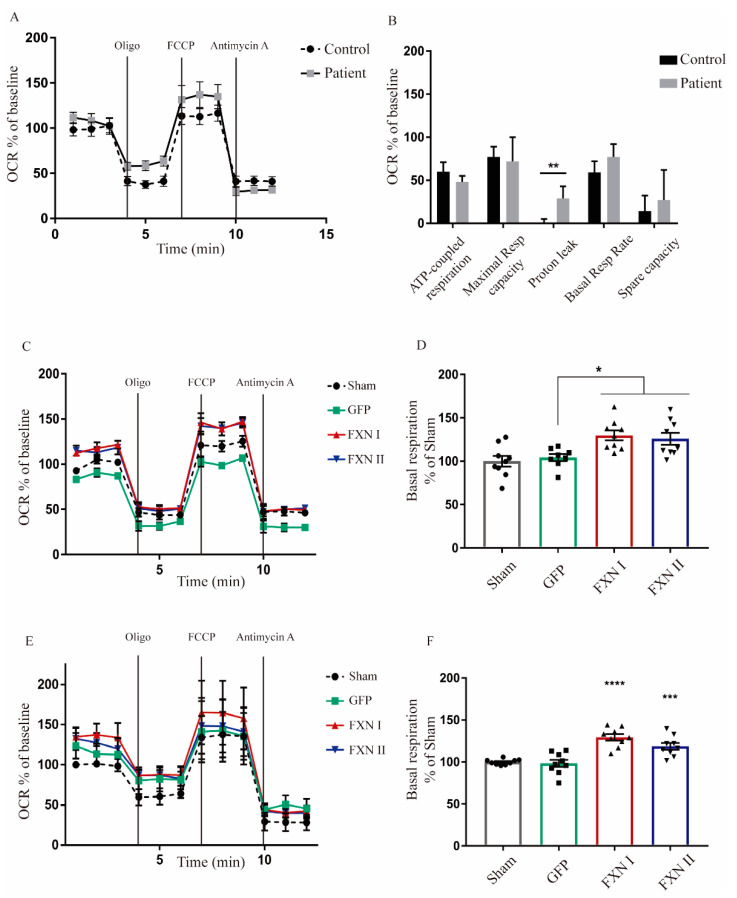
Seahorse assay in OEMS FRDA patients and healthy subjects. (A) Seahorse assay performed in untreated healthy and FRDA patient OE-MS cells showing oxygen consumption rates. The X-axis plots different measurements over time (rates). (B) Normalization of the seahorse results between healthy and patient OE-MSc showing differences in ATP-coupled respiration rate, maximal respiratory capacity, proton leak, basal respiratory rates and spare capacity. (C) Seahorse assay in healthy OE-MS cells either non-transduced or transduced with lentiviral vectors codifying for FXN I, FXN II or GFP as positive transduction control. The X-axis plots different measurements over time (rates). (D) Normalization of basal respiration levels in healthy OE-MS cells after transduction with frataxin isoforms. (E) Seahorse assay in patient OE-MS cells either non-transduced or transduced with lentiviral vectors codifying for FXN I, FXN II or GFP as positive transduction control. The X-axis plots different measurements over time (rates). (F) Normalization of basal respiration levels in FRDA patient OEMS cells after treatment with frataxin isoforms. Data are represented as mean ± SEM and were analyzed with a one-way ANOVA with post hoc Dunnett multiple comparisons test from at least three independent experiments from independent cell culture preparations (n = 3). * p < 0.05; ** p < 0.01; *** p < 0.001; **** p < 0.0001.

