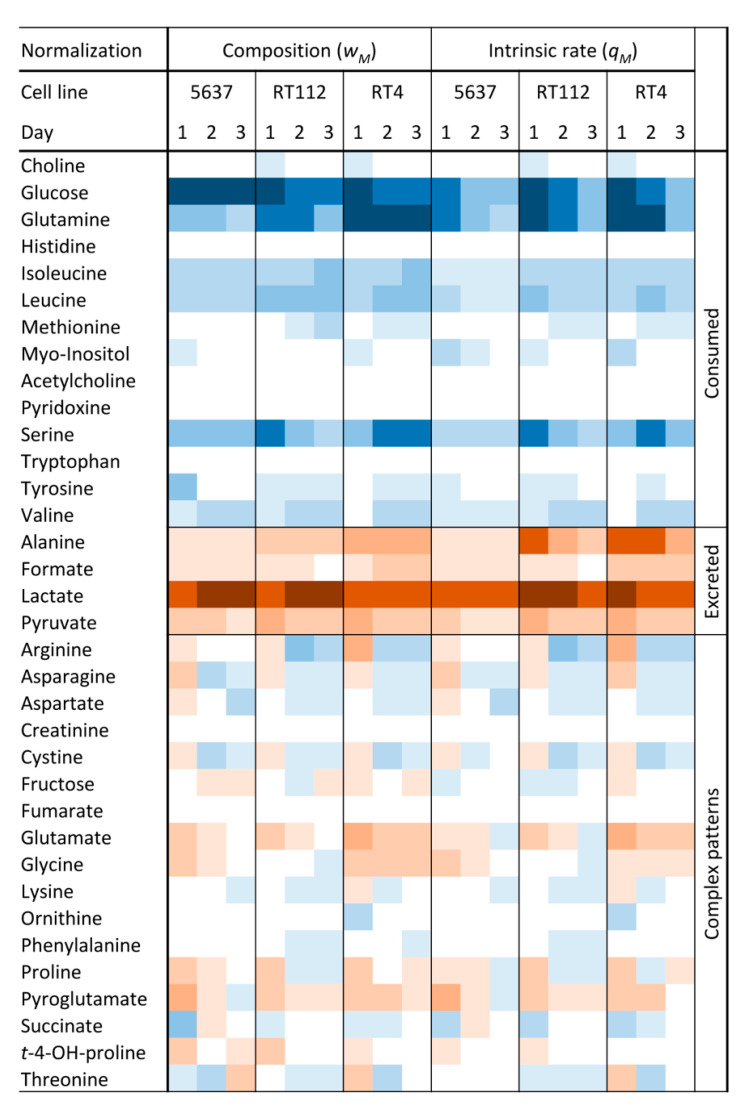
Figure 1.
Heatmap showing the daily variations in metabolite concentrations for the three urothelial bladder cancer cell lines (UBCcls). Variations normalized using both cell growth or total composition are shown. Light blue and brown colors are used for consumption and excretion, respectively. Variations increase from the light to the dark colors.

