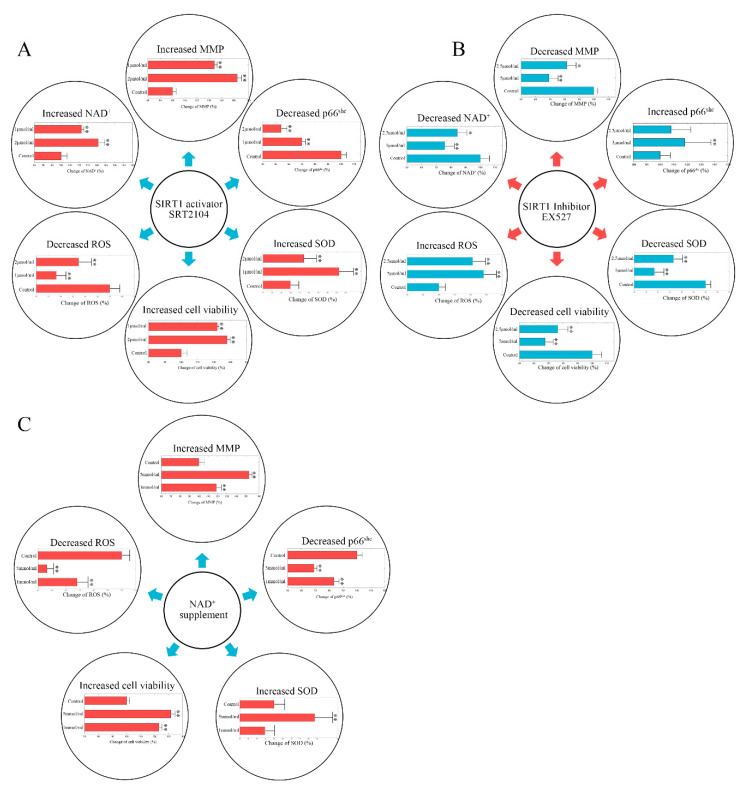
Figure 3.
(A) The change of p66SHC, NAD+, MMP, ROS, Mn-SOD (Mn Superoxide Dismutase), and cell vitality in SRT2104 treated hCMEC/D3 cells. The control group data are normalized to 100%. (B) The change of p66SHC, NAD+, MMP, ROS, Mn-SOD, and cell vitality in EX527 treated hCMEC/D3 cells. The control group data are normalized to 100%. (C) The change of p66SHC, MMP, ROS, Mn-SOD, and cell vitality in NAD+ supplement treated hCMEC/D3 cells. The control group data are normalized to 100%. The difference between different groups was compared by t-test (n = 6). ** p < 0.01 * p < 0.05.

