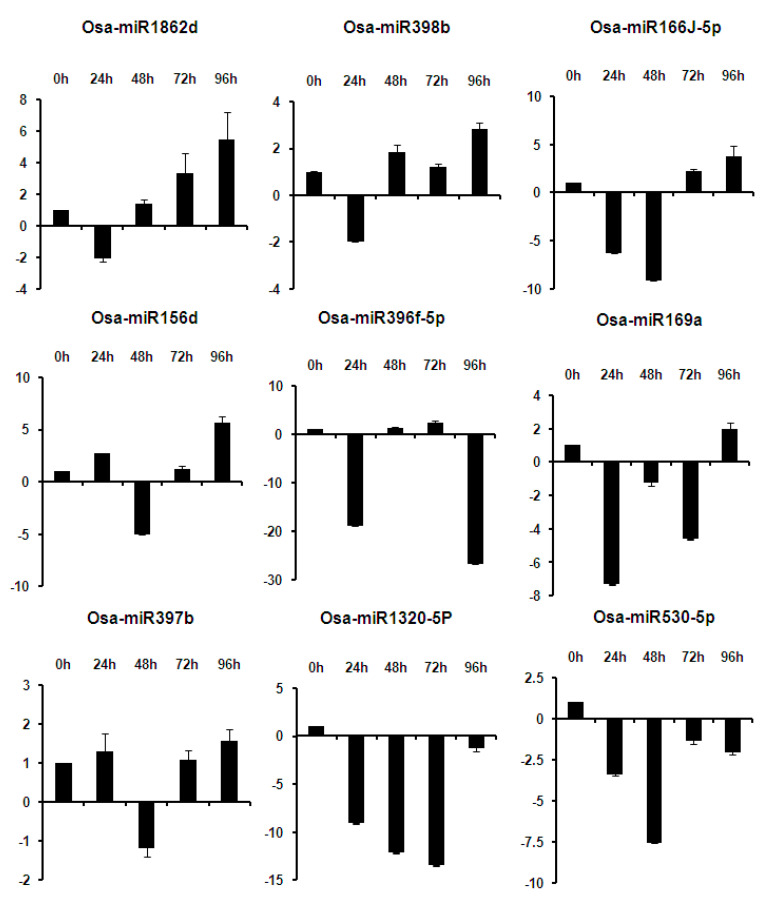
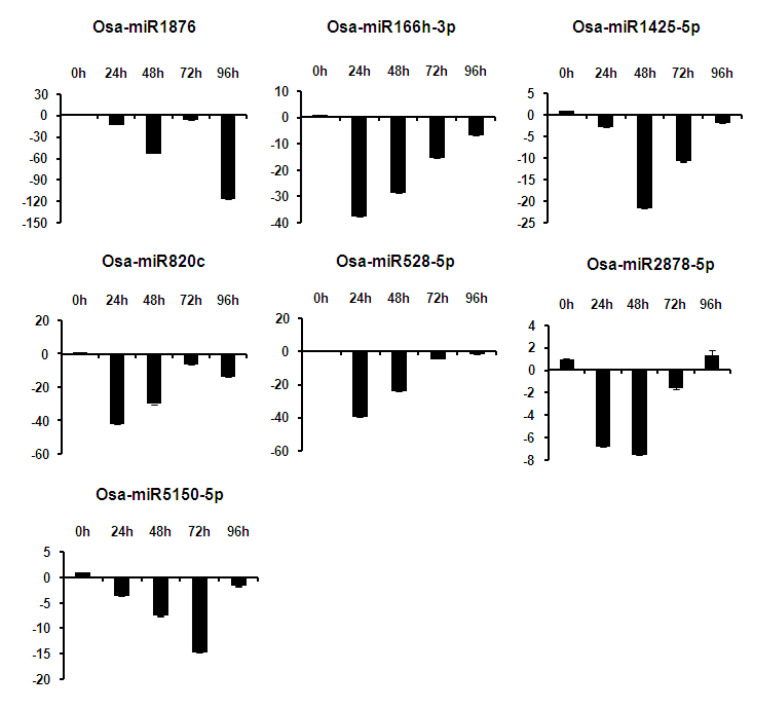
Figure 5.
RT-qPCR expression analysis of miRNAs in the TN1 genotype at different time points after R. solani inoculation. Data is represented after internal reference gene U6 normalization. The error bars represent the standard error of three biological replicates. X-axis: samples and Y-axis: relative expression of miRNAs.


