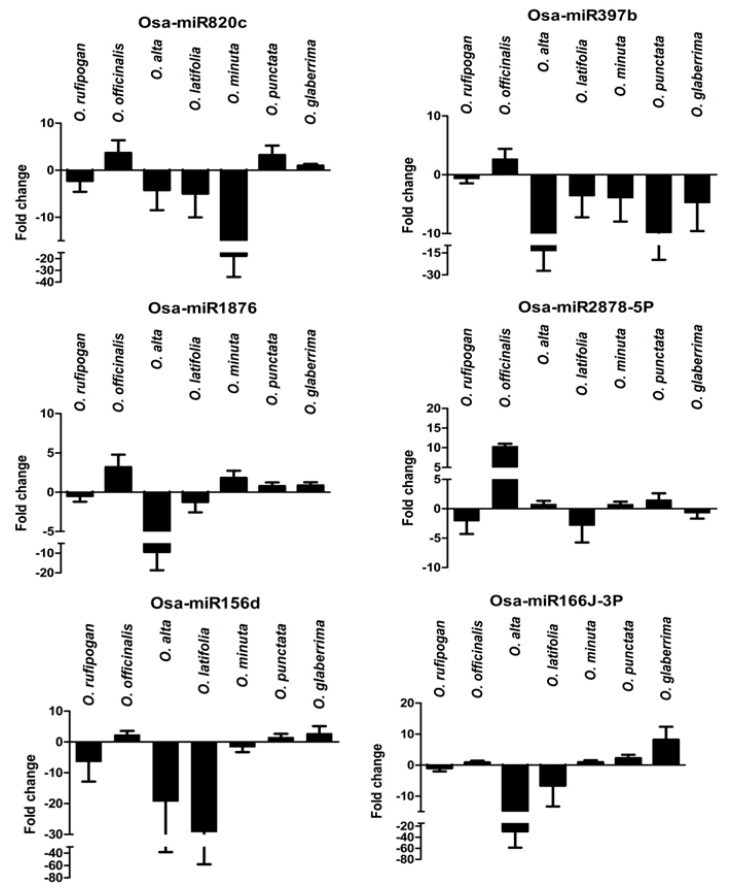
Figure 7.
RT-qPCR expression analysis of miRNAs in wild rice species. Data is represented after internal reference gene U6 normalization. The error bars represent the standard error of three biological replicates. X-axis: samples and Y-axis: fold change expression in the fungal-infected sample in comparison to the respective controls.

