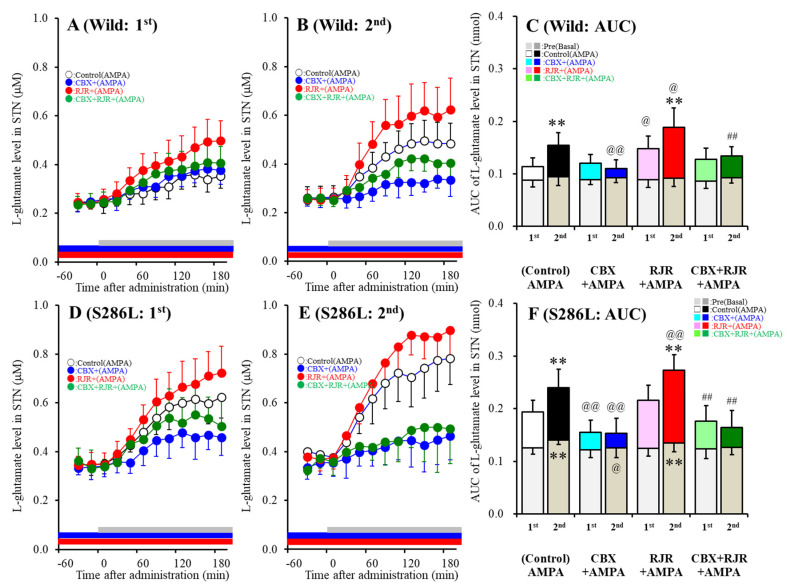
Figure 1.
Effects of the local administration of 100 μM RJR2403 (selective α4β2-nAChR agonist) and 100 μM carbenoxolone (CBX; hemichannel inhibitor) into the orbitofrontal cortex (OFC) on 100 μM amino-3-(3-hydroxy-5-methyl-isoxazol-4-yl)propanoic acid (AMPA)-evoked (perfusion with 100 μM AMPA into the OFC) L-glutamate release in the subthalamic nucleus (STN), before (A,D) and after (B,E) hemichannel activation (FCHK-MRS (Ca2+-free with 100 mM K+ containing modified Ringer’s solution) perfusion) of the wild-type (A,B) and S286L-TG (D,E). The perfusion medium in the OFC began with MRS, with or without (control) 100 μM CBX (blue bars) or 100 μM RJR2403 (red bars). After stabilization of the L-glutamate level in the STN, the perfusion medium was switched to the same MRS containing 100 μM AMPA, for 180 min (first AMPA-evoked stimulation: gray bars). After stabilization of the L-glutamate level in the STN, the perfusion medium was switched from MRS to FCHK-MRS, for 20 min (hemichannel activation). After stabilization of the L-glutamate level in the STN, the perfusion medium was again switched to the same MRS containing 100 μM AMPA, for 180 min (second AMPA-evoked stimulation: gray bars). Ordinates (A,B,D,E) indicate the mean extracellular L-glutamate level (μM) (n = 6), and abscissas indicate the time after AMPA-evoked stimulations (min). (C,F) indicate the area under the curve (AUC) value of the extracellular L-glutamate level (nmol) before (basal extracellular L-glutamate level) and during perfusion with AMPA (from 20 to 180 min) of the wild-type (A,B) and S286L-TG (D,E). Notably, the gray columns in (C,F) indicate the AUC values of the basal extracellular levels of L-glutamate before AMPA-evoked stimulation (basal L-glutamate release) (over −60 to 0 min in (A,B,D,E)). * p < 0.05, ** p < 0.01; relative to the first (first AMPA-evoked stimulation), @p < 0.05, @@p < 0.01; relative to the control, # p < 0.05, ## p < 0.01; relative to RJR by MANOVA with Tukey’s multiple comparison. The F-values of the L-glutamate level in the STN, according to a multivariate analysis of variance (MANOVA), were Fevent(1,80) = 15.1(p < 0.01), FRJR(1,80) = 17.3(p < 0.01), FCBX(1,80) = 76.8(p < 0.01), Fgenotype(1,80) = 128.6 (p < 0.01), Fevent*RJR(1,80) = 0.2 (p > 0.05), Fevent*CBX(1,80) = 21.3(p < 0.01), Fevent*genotype(1,80) = 0.1(p > 0.05), FRJR*CBX(1,80) = 1.8(p > 0.05), FRJR*genotype(1,80)= 0.1(p > 0.05), FCBX*genotype(1,80) = 13.9(p < 0.01), Fevent*RJR*CBX(1,80) = 0.1(p > 0.05), Fevent*RJR*genotype(1,80) = 0.1 (p > 0.05), Fevent*CBX*genotype(1,80) = 0.6(p > 0.05), FRJR*CBX*genotype(1,80) = 0.1(p > 0.05), and Fevent*RJR*CBX*genotype (1,80)= 0.7 (p > 0.05).

