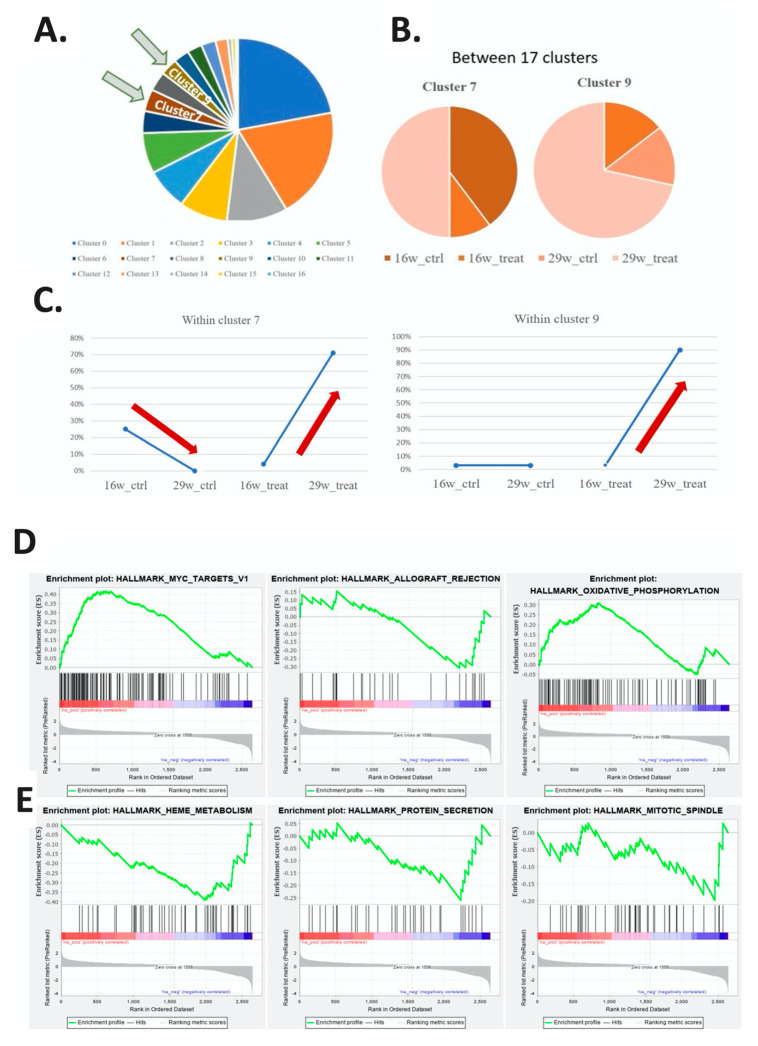
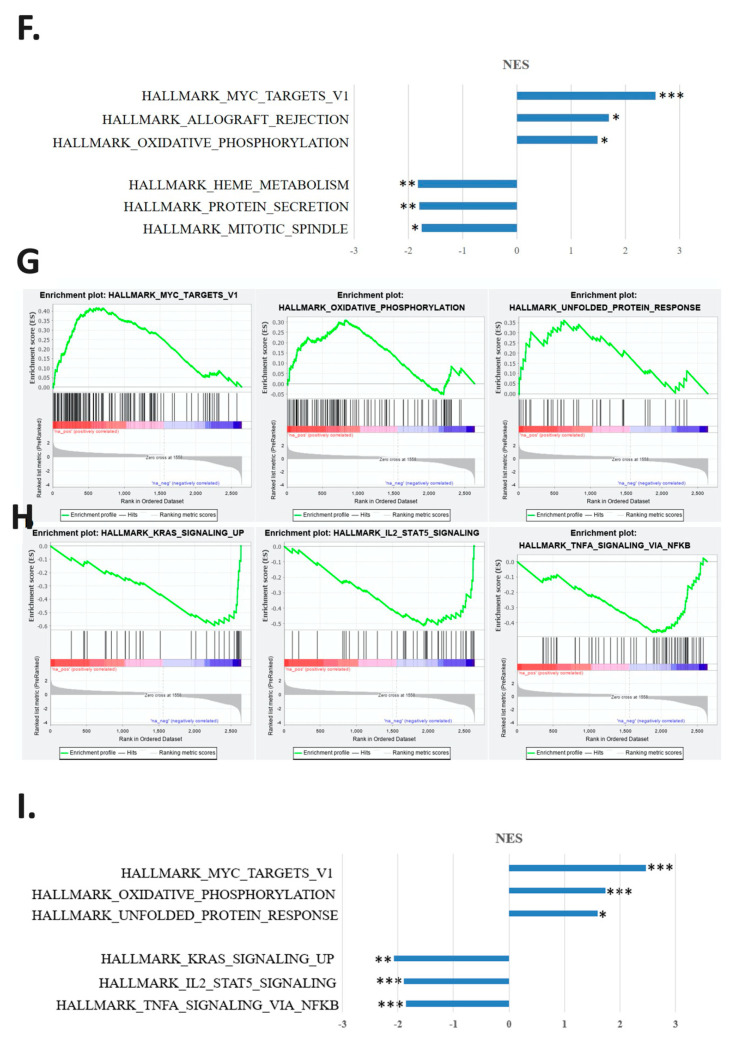
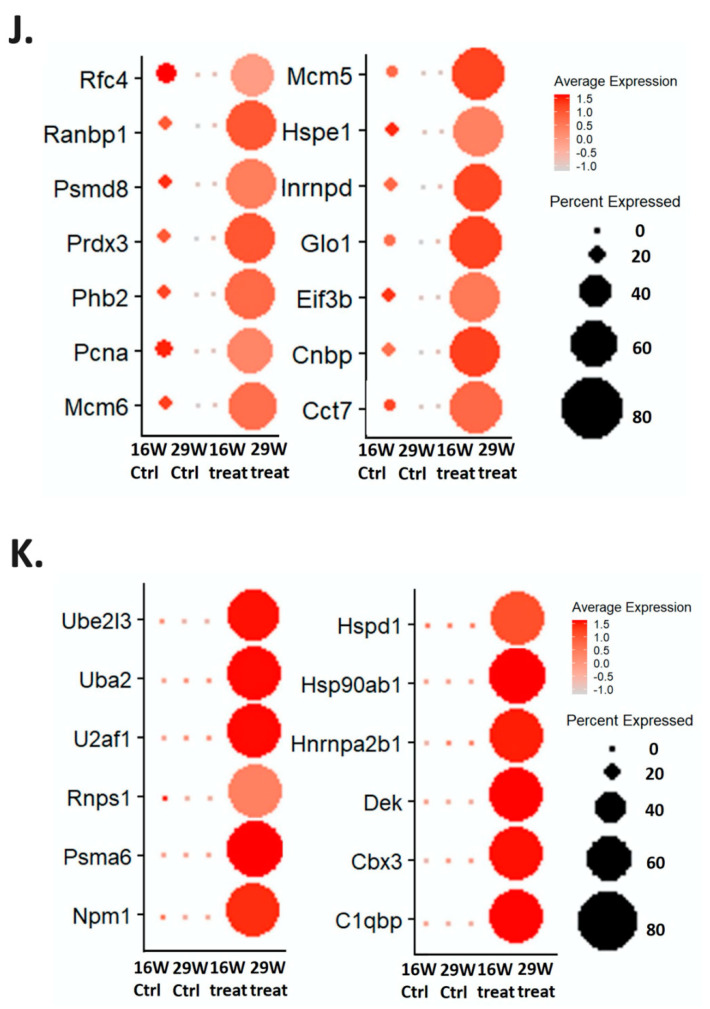
Figure 3.
Comparison of the compositions of cell subtypes between the 16- and 29-week control and experimental groups. (A) Proportion of the 17 cell subtypes with respect to the total cell composition presented as a pie chart. (B) Comparison of the proportion of the seventh and ninth cell subtypes in the four major groups. (C) Line graph comparing the proportions of the seventh and ninth cell subtypes in the four major groups. The proportion increased with increasing treatment duration in in the experimental group. (D–F) Gene function enrichment analysis of the seventh cell subtype. (D) Line chart indicating the three most significant pathways involved in the increase in gene expression in the 16- and 29-week experimental groups. (E) Line chart showing the three most significant pathways involved in the decline in gene expression in the 16- and 29-week experimental groups. (F) Bar graph of the normalized enrichment scores (NESs) and p values of these three paths (* p < 0.05; ** p < 0.01; *** p < 0.001). (G–I) Gene function enrichment analysis of the ninth cell subtype. (G) Line chart indicating the three most significant pathways involved in the increase in gene expression in the 16- and 29-week experimental groups. (H) Line chart showing three most significant pathways involved in the decline in gene expression in the 16- and 29-week experimental groups. (I) Bar graph displaying the calculated NESs and p values of these three paths (* p < 0.05; ** p < 0.01; *** p < 0.001). (J) Dot diagram of genes involved in the MYC_targets_v1 pathway in the seventh subtype. The average gene expression level and the percentage of cells in the four groups are indicated by the color and size of dots. The average expression level and cell ratio of genes in the 29-week experimental group were significantly higher than those in the other groups. (K) Dot diagram of genes involved in the MYC_targets_v1 pathway in the ninth subtype. The average gene expression level and the percentage of cells in the four groups are indicated by the color and size of dots. The average expression level and cell ratio of genes in the 29-week experimental group were significantly higher than those in the other groups.


