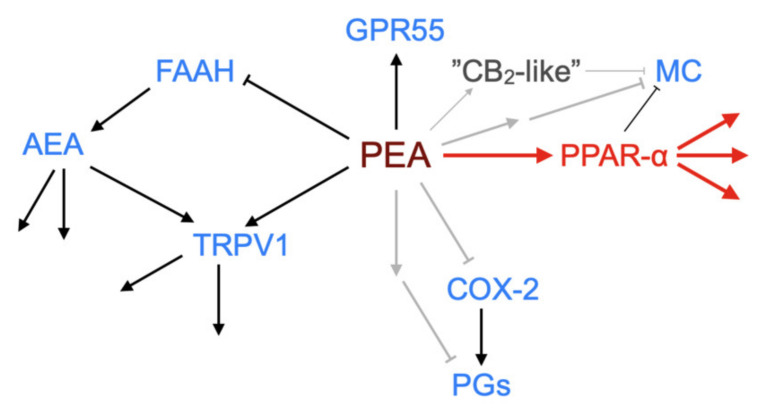
Figure 4.
Schematic showing demonstrated and potential molecular targets of PEA. ↑, activation; ┴, inhibition (in the case of FAAH by substrate competition). The canonical pathway via PPAR-α is shown in red. Grey arrows indicate possible pathways not yet identified. Abbreviations (where not already indicated), TRPV1, Transient receptor potential vanilloid 1; MC, mast cell; COX-2, cyclooxygenase-2; PGs, prostaglandins.

